Program 15: Confusion Matrix and Evaluation Metrics
Write a program to construct the confusion matrix for a classification model and calculate its accuracy, precision, recall and F1 score.
1Aim
2Program
# Program 15: Confusion matrix, accuracy, precision, recall and F1 score
# The activity from the CBSE AI handbook: a model is tested on 1000
# students - 900 actually passed (Yes) and 100 did not (No). A faulty
# model predicts "Yes" for everybody. Then a better model is tested.

import matplotlib.pyplot as plt

actual = ["Yes"] * 900 + ["No"] * 100
faulty = ["Yes"] * 1000
# A better model: right for most students, wrong for a few.
better = ["Yes"] * 870 + ["No"] * 30 + ["No"] * 85 + ["Yes"] * 15

names = ["Faulty model (always Yes)", "Better model"]
for k in range(2):
    predicted = [faulty, better][k]
    tp = tn = fp = fn = 0
    for i in range(len(actual)):
        if actual[i] == "Yes" and predicted[i] == "Yes":
            tp = tp + 1
        elif actual[i] == "No" and predicted[i] == "No":
            tn = tn + 1
        elif actual[i] == "No" and predicted[i] == "Yes":
            fp = fp + 1
        else:
            fn = fn + 1
    accuracy = (tp + tn) / (tp + tn + fp + fn)
    precision = tp / (tp + fp)
    recall = tp / (tp + fn)
    f1 = 2 * precision * recall / (precision + recall)
    # For the "No" class: how many of the students who failed were found?
    no_found = tn / (tn + fp)

    print(names[k])
    print("  TP =", tp, " FN =", fn, " FP =", fp, " TN =", tn)
    print("  Accuracy  =", round(accuracy, 3), "=", round(accuracy * 100, 1), "%")
    print("  Precision =", round(precision, 3))
    print("  Recall    =", round(recall, 3))
    print("  F1 score  =", round(f1, 3))
    print("  Students who did not pass, found by the model:", tn, "of", tn + fp)
    print()

    plt.subplot(1, 2, k + 1)
    grid = [[tp, fn], [fp, tn]]
    plt.imshow(grid, cmap="Blues")
    labels = [["TP", "FN"], ["FP", "TN"]]
    for r in range(2):
        for c in range(2):
            if grid[r][c] > 450:
                ink = "white"
            else:
                ink = "black"
            plt.text(c, r, labels[r][c] + "\n" + str(grid[r][c]), ha="center", va="center",
                     color=ink, fontsize=11)
    plt.xticks([0, 1], ["Pred Yes", "Pred No"])
    plt.yticks([0, 1], ["Actual Yes", "Actual No"])
    plt.title(names[k], fontsize=10)
plt.gcf().set_size_inches(9, 4)
plt.tight_layout()
plt.show()3Output
The output of a real run, exactly as it appeared.
Faulty model (always Yes)
  TP = 900  FN = 0  FP = 100  TN = 0
  Accuracy  = 0.9 = 90.0 %
  Precision = 0.9
  Recall    = 1.0
  F1 score  = 0.947
  Students who did not pass, found by the model: 0 of 100

Better model
  TP = 870  FN = 30  FP = 15  TN = 85
  Accuracy  = 0.955 = 95.5 %
  Precision = 0.983
  Recall    = 0.967
  F1 score  = 0.975
  Students who did not pass, found by the model: 85 of 100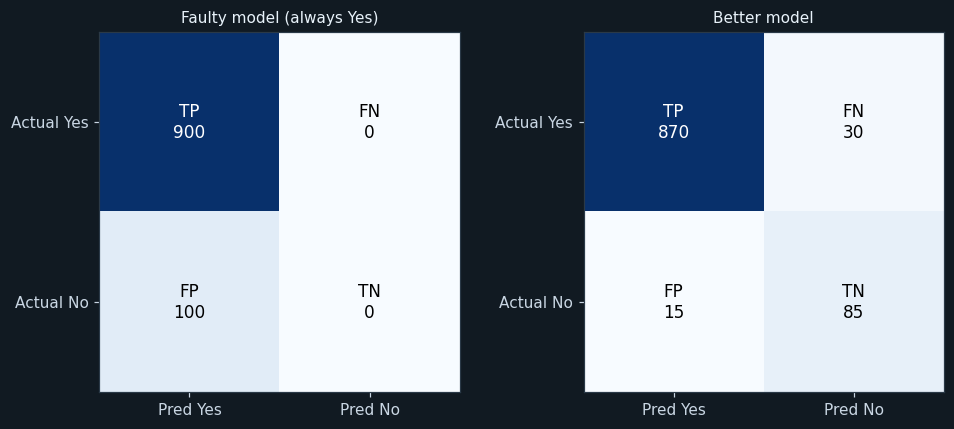
4How it works
["Yes"] * 900 + ["No"] * 100Builds the actual values for the handbook's activity: 900 students passed and 100 did not.
tp, tn, fp, fnThe loop compares each actual value with the prediction and counts the four boxes of the confusion matrix.
(tp + tn) / (tp + tn + fp + fn)Accuracy: correct predictions out of all predictions.
tp / (tp + fp) and tp / (tp + fn)Precision: how many predicted Yes were right. Recall: how many actual Yes were found.
2 * precision * recall / (precision + recall)The F1 score balances precision and recall.
5Try this
- Change the better model so that it finds all 100 students who did not pass.
- Make No the positive class and recalculate.
- Use your own actual and predicted lists of 20 values.
6Viva questions
▸The faulty model has 90% accuracy. Why is it useless?
It predicts Yes for everyone, so it finds none of the 100 students who did not pass. The data is unbalanced, so accuracy is misleading.
▸Write the formula for precision and recall.
Precision = TP / (TP + FP). Recall = TP / (TP + FN).
▸What is the F1 score?
2 × Precision × Recall / (Precision + Recall) — a balance of precision and recall.
▸When should accuracy not be used alone?
When the data is unbalanced, as in this activity.