Artificial Intelligence · Class 10 · Practical File · Program 5 of 15
Charts with MatplotlibFrom the CBSE curriculum list⏱️ 6 min read
Program 5: A Scatter Chart of Five Points
Write a program to display a scatter chart for the following points: (2, 5), (9, 10), (8, 3), (5, 7), (6, 18).
Download
All 15 programs with output, in one PDF1Aim
Write a program to display a scatter chart for the following points: (2, 5), (9, 10), (8, 3), (5, 7), (6, 18).
Python 3Matplotlib
2Program
scatter_chart.py
# Program 5: Display a scatter chart for the points
# (2, 5), (9, 10), (8, 3), (5, 7), (6, 18)

import matplotlib.pyplot as plt

x = [2, 9, 8, 5, 6]
y = [5, 10, 3, 7, 18]

plt.scatter(x, y, color="red", s=80)
for i in range(len(x)):
    # Write each point's coordinates beside it.
    plt.text(x[i] + 0.15, y[i] + 0.3, "(" + str(x[i]) + ", " + str(y[i]) + ")")
plt.title("Scatter chart")
plt.xlabel("x axis")
plt.ylabel("y axis")
plt.grid(True)
plt.show()

print("Points plotted:", len(x))
print("Highest point :", "(" + str(x[y.index(max(y))]) + ", " + str(max(y)) + ")")3Output
The output of a real run, exactly as it appeared.
Output
Points plotted: 5
Highest point : (6, 18)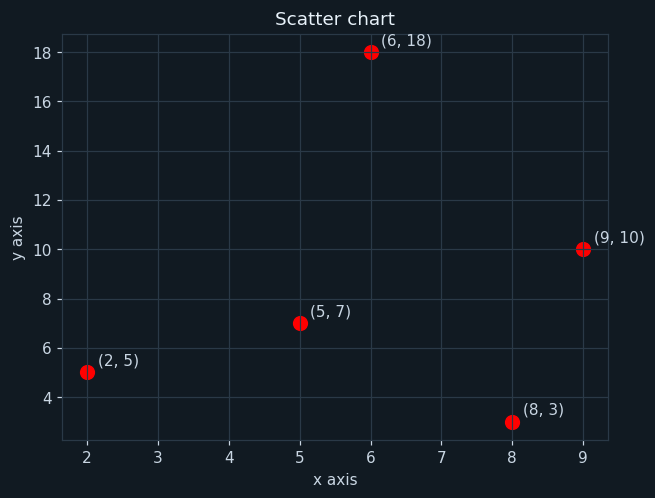
the window opened by plt.show()
4How it works
x = [2, 9, 8, 5, 6] and y = [5, 10, 3, 7, 18]The first number of each point goes in x, the second in y, in the same order.
plt.scatter(x, y, color="red", s=80)Draws each point as a dot without joining them; s sets the size of the dots.
plt.text(x[i] + 0.15, y[i] + 0.3, ...)Writes each point's coordinates just beside it, so the chart can be checked against the question.
y.index(max(y))Finds the position of the largest y value, to report the highest point.
5Try this
- Give every point a different colour.
- Join the points with plt.plot() as well. Why does the line look strange?
- Plot the heights and weights of five friends.
6Viva questions
▸What is the difference between a line chart and a scatter chart?
A line chart joins the points with lines; a scatter chart shows each point as a separate dot.
▸When is a scatter chart used?
To see the relationship between two variables, for example height and weight.
▸Which function draws a scatter chart?
plt.scatter().
Tip
In your practical file, write the aim, the program and the output for each program — run it yourself and copy your own output. See The Practical File for how to set the file out.