Program 3: Variance, Standard Deviation and Outliers
Write a program to find the variance and standard deviation of a set of values, detect an outlier, and show the distribution as a histogram.
1Aim
2Program
# Program 3: Variance, standard deviation and outliers
# Minutes taken by 20 students to finish a quiz. One student left the
# quiz open and came back much later - an outlier.

import numpy as np
import matplotlib.pyplot as plt

minutes = np.array([12, 14, 11, 15, 13, 12, 16, 14, 13, 12,
                    15, 11, 14, 13, 58, 12, 15, 13, 14, 12])

mean = np.mean(minutes)
variance = np.var(minutes)
sd = np.std(minutes)
print("Mean               :", round(mean, 2), "minutes")
print("Variance           :", round(variance, 2))
print("Standard deviation :", round(sd, 2), "minutes")
print()

# An outlier lies an abnormal distance from the other values. A common
# rule: more than 2 standard deviations away from the mean.
low = mean - 2 * sd
high = mean + 2 * sd
print("Normal range       :", round(low, 2), "to", round(high, 2), "minutes")
outliers = minutes[(minutes < low) | (minutes > high)]
print("Outliers           :", outliers)
print()

# Without the outlier, the mean and standard deviation tell the truth.
clean = minutes[(minutes >= low) & (minutes <= high)]
print("Without the outlier:")
print("Mean               :", round(np.mean(clean), 2), "minutes")
print("Standard deviation :", round(np.std(clean), 2), "minutes")

# The distribution of the times, as a histogram.
plt.hist(minutes, bins=12, color="#4e79a7", edgecolor="white")
plt.axvline(mean, color="#e15759", linestyle="--", label="Mean with the outlier")
plt.title("Minutes taken to finish the quiz")
plt.xlabel("Minutes")
plt.ylabel("Number of students")
plt.legend()
plt.show()3Output
The output of a real run, exactly as it appeared.
Mean               : 15.45 minutes
Variance           : 97.15
Standard deviation : 9.86 minutes

Normal range       : -4.26 to 35.16 minutes
Outliers           : [58]

Without the outlier:
Mean               : 13.21 minutes
Standard deviation : 1.4 minutes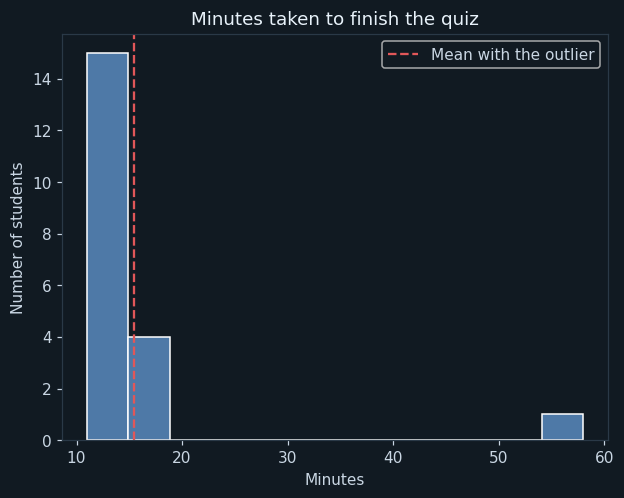
4How it works
np.var(minutes)Variance measures how far the values are from the mean: the average of the squared differences.
np.std(minutes)Standard deviation is the square root of the variance, in the same units as the data (minutes).
mean - 2 * sd, mean + 2 * sdA common rule: a value more than 2 standard deviations from the mean is an outlier.
minutes[(minutes < low) | (minutes > high)]Picks out the values outside the normal range. | means or.
plt.hist(minutes, bins=12)A histogram shows the distribution: how many values fall in each range.
5Try this
- Remove the 58 from the data and run it again.
- Use 3 standard deviations instead of 2. Is 58 still an outlier?
- Change one value to 2 minutes. Is it an outlier?
6Viva questions
▸What is variance?
A measure of how far each value in the data is from the mean — how spread out the data is.
▸What is an outlier?
A data point that lies an abnormal distance from the other values.
▸What did the outlier do to the mean?
It pulled the mean up from about 13 to about 15 minutes, and made the standard deviation much bigger.