Program 10: Grayscale and RGB Images
Write a program to convert a colour image to grayscale, display the pixel value at a point, and split the image into its red, green and blue channels.
1Aim

Keep photo.jpg in the same folder as the program.
2Program
# Program 10: Grayscale and RGB images - pixel values and colour channels

import cv2
import matplotlib.pyplot as plt

image = cv2.imread("photo.jpg")
rgb = cv2.cvtColor(image, cv2.COLOR_BGR2RGB)
grey = cv2.cvtColor(image, cv2.COLOR_BGR2GRAY)

# One pixel: a colour pixel has three values, a grey pixel has one.
row, col = 150, 250
print("Pixel at row", row, "column", col)
print("  in the colour image (R, G, B) :", rgb[row, col])
print("  in the grayscale image        :", grey[row, col])
print()
print("Pixel values run from", grey.min(), "(black) to", grey.max(), "(white)")
print("Data type of each value :", grey.dtype, "(whole numbers 0 to 255)")
print()

# Split the colour image into its three channels.
red = rgb[:, :, 0]
green = rgb[:, :, 1]
blue = rgb[:, :, 2]
print("Average red value   :", round(red.mean(), 1))
print("Average green value :", round(green.mean(), 1))
print("Average blue value  :", round(blue.mean(), 1))

# To see one channel, keep it and set the other two channels to 0.
only_red = rgb.copy()
only_red[:, :, 1] = 0
only_red[:, :, 2] = 0
only_green = rgb.copy()
only_green[:, :, 0] = 0
only_green[:, :, 2] = 0
only_blue = rgb.copy()
only_blue[:, :, 0] = 0
only_blue[:, :, 1] = 0

plt.figure(figsize=(10, 3.6))
pictures = [rgb, grey, only_red, only_green, only_blue]
titles = ["Colour (RGB)", "Grayscale", "Red channel", "Green channel", "Blue channel"]
for i in range(5):
    plt.subplot(1, 5, i + 1)
    if i == 1:
        plt.imshow(pictures[i], cmap="gray")
    else:
        plt.imshow(pictures[i])
    plt.title(titles[i], fontsize=9)
    plt.axis("off")
plt.show()3Output
The output of a real run, exactly as it appeared.
Pixel at row 150 column 250
  in the colour image (R, G, B) : [252 192 164]
  in the grayscale image        : 207

Pixel values run from 0 (black) to 255 (white)
Data type of each value : uint8 (whole numbers 0 to 255)

Average red value   : 82.5
Average green value : 72.4
Average blue value  : 86.4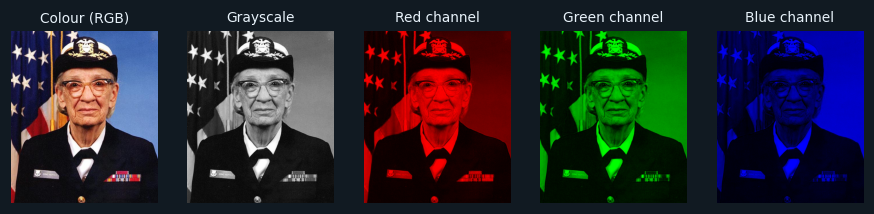
4How it works
cv2.cvtColor(image, cv2.COLOR_BGR2GRAY)Converts the colour image to grayscale: one brightness value per pixel.
rgb[row, col] and grey[row, col]A colour pixel holds three values (R, G, B); a grayscale pixel holds one.
grey.dtypeuint8: whole numbers from 0 to 255. 0 is black and 255 is white.
rgb[:, :, 0]Every row, every column, channel 0 — the red layer on its own.
only_red[:, :, 1] = 0To see the red channel, a copy of the image keeps its red values and sets green and blue to 0. Bright red areas are where the red values are high.
5Try this
- Print the pixel value at a few other points.
- Make a negative image: 255 - grey.
- Set the blue channel to 0 and show the result.
6Viva questions
▸What is the range of pixel values in an 8-bit image?
0 to 255.
▸How is a colour image stored?
As three layers (channels) of numbers — red, green and blue — each with values from 0 to 255.
▸How many values does a grayscale pixel have?
One.