Sending Each Complaint to the Right Desk
Text classification with four classes: a model reads a citizen's complaint — in English or in Hindi typed in English letters — and picks the department that should fix it.
1Introduction
Most cities now let citizens report problems online — no water, a power cut, a pothole, garbage not collected. Thousands of complaints arrive every month.
Each complaint has to reach the right department. Today a person reads them and forwards them, which is slow, and complaints are often sent to the wrong desk and bounced around.
People write in their own words, and often in a mix of English and Hindi typed in English letters: "bijli nahi hai", "kachra nahi uthaya". This project builds a model that reads a complaint and sends it to the right department — Water, Electricity, Roads or Sanitation.
Sustainable Cities and Communities
Clean Water and Sanitation
SDG 11 asks for cities with basic services that work for everyone — water, power, roads and waste collection — and SDG 6 asks for clean water and sanitation in particular. When a citizen reports a burst pipe or uncollected garbage, every day the complaint spends at the wrong desk is a day the problem is not fixed.
The curriculum asks that the project be related to the Sustainable Development Goals. That link is the reason the problem is worth solving, so it belongs at the very start of the report, not tacked on at the end.
2Stage 1 — Problem Scoping
Problem scoping means understanding the problem properly before building anything. The tool for it is the 4Ws Problem Canvas: who has the problem, what the problem is, where it happens, and why solving it matters.
- Citizens who report problems
- The helpline staff and the four departments
- Complaints are sorted slowly by hand
- Complaints sent to the wrong desk wait longer to be fixed
- A city's online complaint portal
- Every day, as complaints arrive
- Problems reach the people who can fix them faster
- Staff spend time fixing problems, not forwarding emails
The problem statement
The four answers are then joined into one sentence, using the curriculum's problem statement template:
A city's complaint helpline or online portal, and the citizens who use it.
How it is done today
Accurate when there is time, but slow, and with thousands of complaints mistakes creep in.
Many portals ask the citizen to pick a department from a list. People often pick the wrong one — is a pothole full of water a Water problem or a Roads problem?
Search for words like "water" or "garbage". Quick, but easily fooled — this project measures how often.
Objectives
- To read citizens' complaints from a CSV file and remove blank ones
- To normalise the text and find the words typical of each department
- To build keyword rules written by a person
- To build word profiles learned from the training complaints
- To compare them with a 4 × 4 confusion matrix and per-department results
- To route new complaints, including ones in Hindi typed in English letters
📘 Revise: Stage 1 — Problem Scoping
3Stage 2 — Data Acquisition
Each row is one complaint: an ID, the complaint as the citizen typed it, and the department that actually dealt with it — the label.
The file has 441 rows, an equal number for each department.
The complaints were put together by a program from phrases citizens commonly use, so no real person's complaint is included. For your own project, you could collect complaints about your school — broken benches, water coolers, lights — with an anonymous form, and label each one with the person who should fix it.
Features and label
The features are what the model is given. The label is the answer it has to learn to give.
| Column | Type | What it holds | Role |
|---|---|---|---|
complaint | text | What the citizen wrote — turned into tokens | feature |
department | text | Water, Electricity, Roads or Sanitation — what the model must predict | label |
complaint_id | text | An ID for the complaint — no names | not used |
The first six rows of complaints.csv
| complaint_id | complaint | department |
|---|---|---|
C5362 | Overflowing dustbin near the market, very bad smell | Sanitation
|
C5177 | Voltage fluctuation opposite the hospital is damaging our appliances. Kindly do something | Electricity
|
C5135 | The electricity meter shows a wrong reading opposite the hospital | Electricity
|
C5080 | Paani nahi aa raha near the market for 10 days | Water
|
C5021 | Paani ki pipeline leak ho rahi hai opposite the hospital | Water
|
C5246 | Sadak toot gayi hai Sector 30 | Roads
|
Inside complaints.csv
Citizens' complaints, each labelled with the department that dealt with it. One complaint was submitted blank. The whole file is 441 rows, 30.5 KB. It comes with the project download, and you can take the file on its own.
📘 Revise: Stage 2 — Data Acquisition
4Stage 3 — Data Exploration
Data exploration means getting to know the data before trusting it: fixing what is wrong with it, then drawing it to see the patterns. The charts here are what decide what the model should be.
What was wrong with the data
A complaint of only spaces has nothing to route. str.strip() removes the spaces, and a complaint left empty is removed.
Words like sector, ward, block, days and week appear in every department's complaints, so they cannot help choose one. They are treated as stop words. Numbers are removed with all other non-letters.
Kept, because they carry the meaning. Hindi grammar words that carry none — hai, nahi, raha — are added to the stop words.
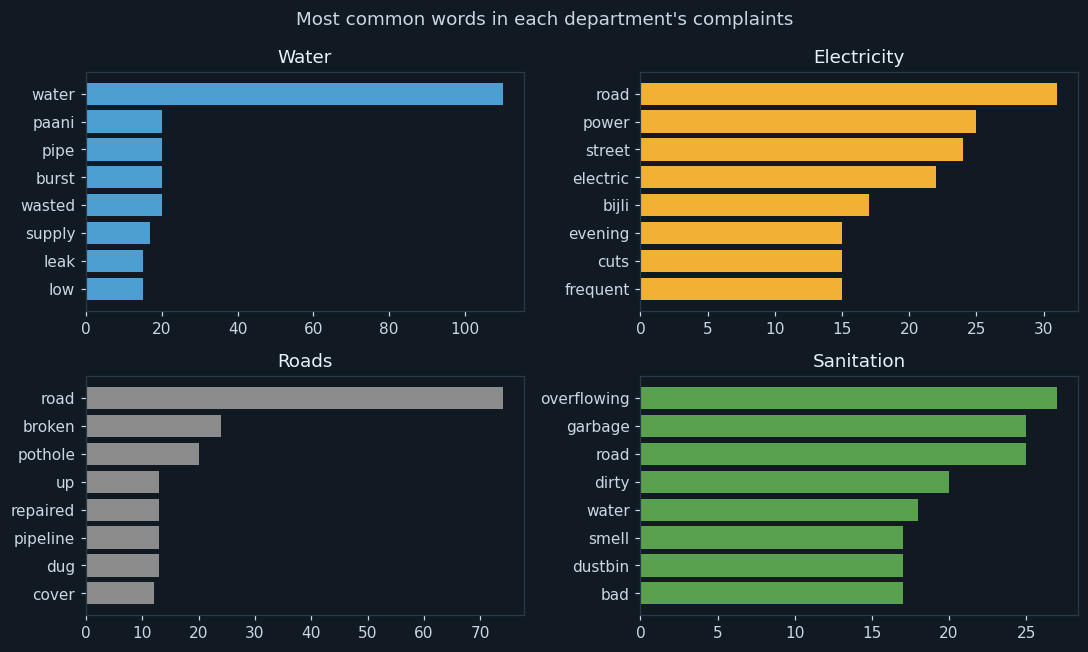
Four small charts, one per department, each showing its eight most common tokens.
Each department has its own vocabulary: water, paani and pipe for Water; power, street and bijli for Electricity; broken, pothole and dug for Roads; garbage, dustbin and smell for Sanitation. That is why a model can route complaints from words alone.
But look for words that appear in more than one chart. Road is near the top for Electricity and Sanitation as well as Roads ("street light... road is dark", "dead animal on the road"), and water appears under Sanitation ("dirty water on the street"). Those shared words are where the mistakes will come from.
📘 Revise: Stage 3 — Data Exploration
5Stage 4 — Modelling
Where this model sits in the family of AI models:
The answer is one of four departments, so this is classification with four classes. The training complaints are labelled, so it is supervised learning, in the NLP domain.
How the model works
The complaints are split into 352 for training and 88 for testing.
Model A is rule based: a person wrote a list of keywords for each department. A complaint goes to the department with the most matching keywords. If no keyword matches, the rules cannot place it at all.
Model B is learning based. For each department, it looks at all the words in that department's training complaints and works out what share of them each word makes up — its word profile. For example, it learned that water is Water 24.2%, Electricity 0%, Roads 2.5%, Sanitation 4.0%. A new complaint is scored against each profile by adding up the shares of its words, and goes to the department with the highest score.
📘 Revise: Stage 4 — Modelling
6Stage 5 — Evaluation
On 88 testing complaints, the keyword rules routed 67 of 88 correct — an accuracy of 76.1 %. The word profiles routed 80 of 88 correct — 90.9 %.
The output lists the complaints the keyword rules got wrong, and they fall into two groups. Many are in Hindi typed in English letters, with no keyword the rules know, so they are left unplaced. The rest contain another department's word, like "stagnant water" in a Sanitation complaint. The word profiles learned paani, bijli, sadak and kachra from the training data, which fixed the first group.
The second group is harder. A word like water belongs mostly to one department, so a complaint that mentions it is pulled there even when other words — drain, mosquitoes — point elsewhere. Adding up words one at a time cannot understand that "dirty water on the street from a blocked drain" is a drain problem.
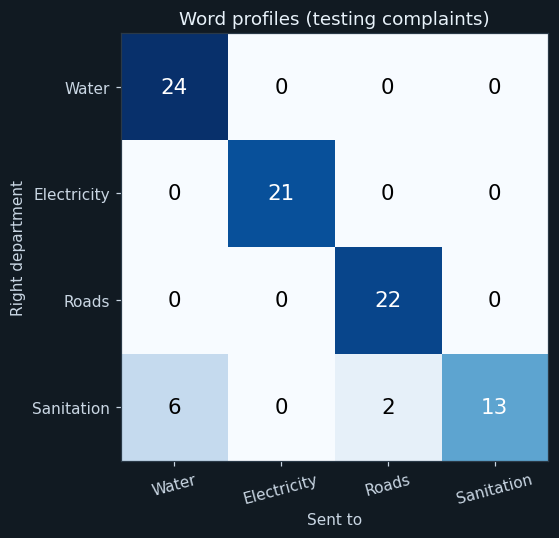
Rows are the right department; columns are where the model sent the complaint. The diagonal holds correct routings.
Water, Electricity and Roads complaints are routed almost perfectly. Most of the mistakes are in one cell: Sanitation complaints sent to Water. They are complaints like "drain blocked, dirty water on the street" — the word water is so strongly linked to the Water department that it outweighs the word drain.
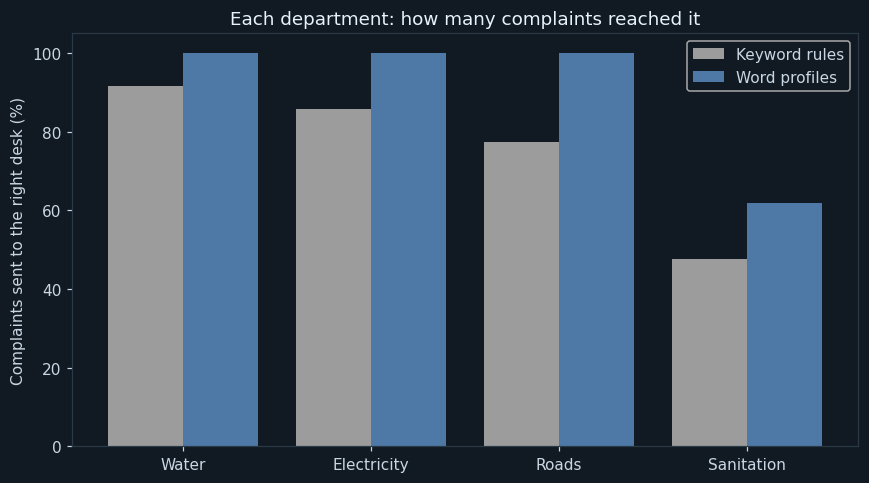
For each department: the share of its testing complaints that each model sent to it — the recall for that department.
The word profiles do better for every department. The gap is biggest where complaints are often written in Hindi or use another department's words — the keyword rules could not place 13 testing complaints at all.
📘 Revise: The Confusion Matrix
7Stage 6 — Deployment
The program routes four new complaints, and all four go to the right desk — including two written in Hindi that the keyword rules would not have understood at all, and "Huge pothole filled with rain water", which mentions water but belongs to Roads.
The pothole complaint is a near thing: water pulls it towards Water, and only pothole and road pull it back. In real use, the helpline should show each department's score with the complaint, and a person should check any complaint where two departments score nearly the same.
📘 Revise: Stage 6 — Deployment
8Ethical concerns
An AI project is not finished when the model works. The curriculum asks three questions of every model — is it fair (bias), can it explain itself (transparency), and who answers for its mistakes (accountability). For this project:
People write in many languages and styles. A model that only understands formal English would send some citizens' complaints to the wrong place more often — and those are often the people with the least time to complain again. The training data must include the ways all citizens really write.
Complaints can contain names, phone numbers and addresses. These should be removed or protected before any data is used to train a model.
A wrongly routed complaint means a problem left unfixed. The helpline remains responsible, so complaints with uncertain scores should be checked by a person.
📘 Revise: Bias, Transparency, Accountability
9Source code
The whole program — it is also in the downloads at the top of this page — in Python with pandas, NumPy and matplotlib — the three libraries of Unit 7. It is laid out as the six stages of the AI Project Cycle, one after another. Every chart on this page was drawn by it, and every number came out of running it.
# ---------------------------------------------------------------------------
# complaint_routing.py
#
# AI project on Natural Language Processing: reading a citizen's complaint
# and sending it to the right department - Water, Electricity, Roads or
# Sanitation.
#
# CBSE Class X, Artificial Intelligence (417), Part C project work.
# SDG 11 (Sustainable Cities and Communities) and SDG 6 (Clean Water and
# Sanitation).
#
# This is text classification with FOUR classes. Two models are compared:
#   - KEYWORD RULES (rule based): a person writes a list of words for each
#     department; the department with the most matching words wins.
#   - WORD PROFILES (learning based): from the training complaints, the
#     program learns how often each word is used in each department's
#     complaints, and sends a new complaint to the department whose words
#     it uses most.
#
# Libraries: pandas (the complaints), numpy, matplotlib.
# ---------------------------------------------------------------------------

# %% Stage 1 - Problem scoping
print("=" * 60)
print("SENDING EACH COMPLAINT TO THE RIGHT DESK")
print("=" * 60)
print("Who   : the city helpline, and citizens who complain")
print("What  : complaints are sorted by hand, slowly, and often wrongly")
print("Where : a city's online complaint portal")
print("Why   : a complaint at the right desk gets fixed sooner")
print()

# %% Stage 2 - Data acquisition
import pandas as pd
import numpy as np
import matplotlib.pyplot as plt

pd.set_option("display.width", 140)
pd.set_option("display.max_colwidth", 90)

data = pd.read_csv("complaints.csv")
departments = ["Water", "Electricity", "Roads", "Sanitation"]

print("--- Stage 2: Data acquisition ---")
print("Complaints read :", len(data))
print()
print(data.head(6).to_string(index=False))
print()

# %% Stage 3 - Data exploration
print("--- Stage 3: Data exploration ---")
blank = (data["complaint"].str.strip() == "").sum()
data = data[data["complaint"].str.strip() != ""]
print("Blank complaints   :", blank, "(removed)")
print("Complaints left    :", len(data))
print()
counts = data["department"].value_counts().reindex(departments)
print("Complaints for each department:")
print(counts.to_string())
print()

stop_words = ["the", "a", "an", "is", "are", "was", "for", "of", "in", "on", "at", "to",
              "and", "our", "since", "very", "has", "been", "does", "not", "no", "please",
              "help", "kindly", "do", "something", "nobody", "listening", "before", "also",
              "near", "behind", "opposite", "sector", "ward", "block", "days", "day", "week",
              "two", "three", "morning", "monday", "hai", "ho", "rahi", "raha", "nahi", "ki",
              "aa", "complained", "every", "being", "it", "that", "too",
              "colony", "market", "temple", "school", "hospital", "station", "bus", "stand"]

tokens_list = []
for text in data["complaint"]:
    clean = ""
    for ch in text.lower():
        if ch.isalpha():
            clean = clean + ch
        else:
            clean = clean + " "
    tokens = []
    for w in clean.split():
        if w not in stop_words and len(w) > 1:
            tokens.append(w)
    tokens_list.append(tokens)
data["tokens"] = tokens_list

print("Text normalisation of one complaint:")
print("  Original :", data.iloc[0]["complaint"])
print("  Tokens   :", data.iloc[0]["tokens"])
print()

# Chart 1: the most common words in each department's complaints.
plt.figure(figsize=(10, 6))
colours = ["#4e9fd1", "#f2b134", "#8c8c8c", "#59a14f"]
for k in range(4):
    word_count = {}
    for tokens in data[data["department"] == departments[k]]["tokens"]:
        for w in tokens:
            word_count[w] = word_count.get(w, 0) + 1
    top = pd.Series(word_count).sort_values(ascending=False).head(8)
    plt.subplot(2, 2, k + 1)
    plt.barh(top.index[::-1], top.values[::-1], color=colours[k])
    plt.title(departments[k])
plt.suptitle("Most common words in each department's complaints")
plt.tight_layout()
plt.savefig("chart1_department_words.png")
plt.close()

# %% Stage 4 - Modelling
print("--- Stage 4: Modelling ---")
data = data.sample(frac=1, random_state=21)
cut = int(len(data) * 0.8)
train = data[:cut]
test = data[cut:]
print("Training complaints :", len(train))
print("Testing complaints  :", len(test))
print()

# Model A - KEYWORD RULES, written by a person.
keywords = {
    "Water":       ["water", "tap", "taps", "pipe", "tanker", "supply"],
    "Electricity": ["power", "light", "lights", "electric", "electricity", "transformer", "voltage", "wire"],
    "Roads":       ["road", "pothole", "footpath", "traffic", "divider"],
    "Sanitation":  ["garbage", "drain", "dustbin", "toilet", "sewer", "smell"],
}

# Model B - WORD PROFILES, learned. For each department: what share of all
# the words in its training complaints is each word?
profile = {}
for d in departments:
    word_count = {}
    total = 0
    for tokens in train[train["department"] == d]["tokens"]:
        for w in tokens:
            word_count[w] = word_count.get(w, 0) + 1
            total = total + 1
    shares = {}
    for w in word_count:
        shares[w] = word_count[w] / total
    profile[d] = shares

for w in ["water", "paani", "bijli", "kachra", "road"]:
    line = "Learned share of '" + w + "'"
    parts = []
    for d in departments:
        parts.append(d + " " + str(round(profile[d].get(w, 0) * 100, 1)) + "%")
    print(line.ljust(26), ":", ", ".join(parts))
print()

rule_said = []
learned_said = []
for tokens in test["tokens"]:
    best_rule = "Unknown"
    best_hits = 0
    best_learned = None
    best_score = -1
    for d in departments:
        hits = 0
        score = 0
        for w in tokens:
            if w in keywords[d]:
                hits = hits + 1
            score = score + profile[d].get(w, 0)
        if hits > best_hits:
            best_hits = hits
            best_rule = d
        if score > best_score:
            best_score = score
            best_learned = d
    rule_said.append(best_rule)
    learned_said.append(best_learned)

# %% Stage 5 - Evaluation
print("--- Stage 5: Evaluation ---")
actual = list(test["department"])
rule_right = 0
learned_right = 0
unknown = 0
for i in range(len(actual)):
    if rule_said[i] == actual[i]:
        rule_right = rule_right + 1
    if learned_said[i] == actual[i]:
        learned_right = learned_right + 1
    if rule_said[i] == "Unknown":
        unknown = unknown + 1
rule_acc = rule_right / len(actual) * 100
learned_acc = learned_right / len(actual) * 100
print("Keyword rules  :", rule_right, "of", len(actual), "correct")
print("Word profiles  :", learned_right, "of", len(actual), "correct")
print("Accuracy of the keyword rules :", round(rule_acc, 1), "%")
print("Accuracy of the word profiles :", round(learned_acc, 1), "%")
print("Complaints the keyword rules could not place :", unknown)
print()

matrix = pd.crosstab(pd.Series(actual, name="Actual"), pd.Series(learned_said, name="Sent to"))
matrix = matrix.reindex(index=departments, columns=departments, fill_value=0)
print("Confusion matrix of the word profiles:")
print(matrix)
print()

print("Where the keyword rules went wrong (first 5):")
shown = 0
for i in range(len(actual)):
    if rule_said[i] != actual[i] and shown < 5:
        print("  [" + actual[i] + ", rules said " + rule_said[i] + "]", test.iloc[i]["complaint"])
        shown = shown + 1
print()

# Chart 2: confusion matrix.
plt.figure(figsize=(6, 5))
plt.imshow(matrix.values, cmap="Blues")
for r in range(4):
    for c in range(4):
        value = matrix.values[r][c]
        if value > matrix.values.max() / 2:
            ink = "white"
        else:
            ink = "black"
        plt.text(c, r, value, ha="center", va="center", fontsize=14, color=ink)
plt.xticks(range(4), departments, rotation=15)
plt.yticks(range(4), departments)
plt.xlabel("Sent to")
plt.ylabel("Right department")
plt.title("Word profiles (testing complaints)")
plt.tight_layout()
plt.savefig("chart2_matrix.png")
plt.close()

# Chart 3: share of each department's complaints sent to the right desk.
rule_recall = []
learned_recall = []
for d in departments:
    total = 0
    r_ok = 0
    l_ok = 0
    for i in range(len(actual)):
        if actual[i] == d:
            total = total + 1
            if rule_said[i] == d:
                r_ok = r_ok + 1
            if learned_said[i] == d:
                l_ok = l_ok + 1
    rule_recall.append(r_ok / total * 100)
    learned_recall.append(l_ok / total * 100)
x = np.arange(4)
plt.figure(figsize=(8, 4.5))
plt.bar(x - 0.2, rule_recall, width=0.4, label="Keyword rules", color="#9c9c9c")
plt.bar(x + 0.2, learned_recall, width=0.4, label="Word profiles", color="#4e79a7")
plt.xticks(x, departments)
plt.ylim(0, 105)
plt.ylabel("Complaints sent to the right desk (%)")
plt.title("Each department: how many complaints reached it")
plt.legend()
plt.tight_layout()
plt.savefig("chart3_by_department.png")
plt.close()

# %% Stage 6 - Deployment
print("--- Stage 6: Deployment ---")
new_complaints = [
    "Bijli nahi hai in Sector 12 since yesterday night",
    "Huge pothole filled with rain water on MG Road",
    "Kachra pada hai near the bus stand, nobody is cleaning",
    "Drinking water tanker has not come to Ward 7",
]
for text in new_complaints:
    clean = ""
    for ch in text.lower():
        if ch.isalpha():
            clean = clean + ch
        else:
            clean = clean + " "
    best = None
    best_score = -1
    for d in departments:
        score = 0
        for w in clean.split():
            if w not in stop_words:
                score = score + profile[d].get(w, 0)
        if score > best_score:
            best_score = score
            best = d
    print(text.ljust(56), "->", best, "department")
The library calls it is built from
| Call | Where | What it does |
|---|---|---|
str.strip() == "" | Stage 3 | Finds blank complaints |
ch.isalpha() / split() | Stage 3 | Keeps letters and splits into tokens |
if w not in stop_words | Stage 3 | Removes stop words, including place and time words |
word_count.get(w, 0) + 1 | Stages 3, 4 | Counts each word |
keywords = {...} | Stage 4 | The hand-written keyword lists |
word_count[w] / total | Stage 4 | A word's share of a department's words — its profile |
score + profile[d].get(w, 0) | Stage 4 | Scores a complaint against one department |
pd.crosstab() | Stage 5 | The 4 × 4 confusion matrix |
plt.subplot(2, 2, k) | Stage 3 | Four small charts in one figure |
10Sample output
A real run, exactly as it appeared. Nothing below was typed by hand.
============================================================
SENDING EACH COMPLAINT TO THE RIGHT DESK
============================================================
Who   : the city helpline, and citizens who complain
What  : complaints are sorted by hand, slowly, and often wrongly
Where : a city's online complaint portal
Why   : a complaint at the right desk gets fixed sooner

--- Stage 2: Data acquisition ---
Complaints read : 441

complaint_id                                                                                 complaint  department
       C5362                                       Overflowing dustbin near the market, very bad smell  Sanitation
       C5177 Voltage fluctuation opposite the hospital is damaging our appliances. Kindly do something Electricity
       C5135                         The electricity meter shows a wrong reading opposite the hospital Electricity
       C5080                                            Paani nahi aa raha near the market for 10 days       Water
       C5021                                  Paani ki pipeline leak ho rahi hai opposite the hospital       Water
       C5246                                                             Sadak toot gayi hai Sector 30       Roads

--- Stage 3: Data exploration ---
Blank complaints   : 1 (removed)
Complaints left    : 440

Complaints for each department:
department
Water          110
Electricity    110
Roads          110
Sanitation     110

Text normalisation of one complaint:
  Original : Overflowing dustbin near the market, very bad smell
  Tokens   : ['overflowing', 'dustbin', 'bad', 'smell']

--- Stage 4: Modelling ---
Training complaints : 352
Testing complaints  : 88

Learned share of 'water'   : Water 24.2%, Electricity 0%, Roads 2.5%, Sanitation 4.0%
Learned share of 'paani'   : Water 5.1%, Electricity 0%, Roads 0%, Sanitation 0%
Learned share of 'bijli'   : Water 0%, Electricity 4.3%, Roads 0%, Sanitation 0%
Learned share of 'kachra'  : Water 0%, Electricity 0%, Roads 0%, Sanitation 2.6%
Learned share of 'road'    : Water 1.7%, Electricity 7.7%, Roads 18.8%, Sanitation 7.3%

--- Stage 5: Evaluation ---
Keyword rules  : 67 of 88 correct
Word profiles  : 80 of 88 correct
Accuracy of the keyword rules : 76.1 %
Accuracy of the word profiles : 90.9 %
Complaints the keyword rules could not place : 13

Confusion matrix of the word profiles:
Sent to      Water  Electricity  Roads  Sanitation
Actual
Water           24            0      0           0
Electricity      0           21      0           0
Roads            0            0     22           0
Sanitation       6            0      2          13

Where the keyword rules went wrong (first 5):
  [Sanitation, rules said Unknown] Kachra nahi uthaya near the temple since 10 days
  [Roads, rules said Unknown] Sadak toot gayi hai Sector 30
  [Sanitation, rules said Water] Mosquitoes breeding in stagnant water Ward 32
  [Electricity, rules said Unknown] Bijli nahi hai in our colony since a week
  [Sanitation, rules said Unknown] Kachra nahi uthaya in Block F since three days

--- Stage 6: Deployment ---
Bijli nahi hai in Sector 12 since yesterday night        -> Electricity department
Huge pothole filled with rain water on MG Road           -> Roads department
Kachra pada hai near the bus stand, nobody is cleaning   -> Sanitation department
Drinking water tanker has not come to Ward 7 -> Water department11The same project without code
Orange can learn a four-class text classifier with a few widgets, and its confusion matrix shows the same Sanitation–Water confusion. The tool is Orange Data Mining (with the Text add-on).
Load complaints.csv with complaint as the text feature and department as the target.
Lowercase, remove punctuation and numbers, filter stop words. Add sector, ward, hai, nahi to the stop word list.
Turn each complaint into word counts.
Select one department's complaints at a time to see its vocabulary.
Naive Bayes is built on the same idea as the word profiles here.
Read the Sanitation complaints sent to Water.
📘 Revise: No-Code AI, and Orange
12Testing
Every case below was actually run, and the result is what came back. Each one gives the whole program a small input of its own.
| Test case | Expected | Actual | Result |
|---|---|---|---|
| All complaints are read | Complaints read : 441 | Complaints read : 441 | Pass |
| A blank complaint (only spaces) is removed | Blank complaints : 1 (removed) | Blank complaints : 1 (removed) | Pass |
| Word profiles beat keyword rules | Accuracy of the word profiles : 90.9 % | Accuracy of the word profiles : 90.9 % | Pass |
| Hindi words in English letters are learned: paani belongs to Water | Learned share of 'paani' : Water 5.1%, Electricity 0%, Roads 0%, Sanitation 0% | Learned share of 'paani' : Water 5.1%, Electricity 0%, Roads 0%, Sanitation 0% | Pass |
| A Hindi complaint the keyword list has never heard of is still routed | Bijli nahi hai in Sector 12 since yesterday night -> Electricity department | Bijli nahi hai in Sector 12 since yesterday night -> Electricity department | Pass |
| Four departments with no shared words: every complaint routed right | Accuracy of the word profiles : 100.0 % | Accuracy of the word profiles : 100.0 % | Pass |
| A complaint of only punctuation has no tokens but does not crash the program | Complaints left : 61 | Complaints left : 61 | Pass |
| The data file is missing | FileNotFoundError: [Errno 2] No such file or directory: 'complaints.csv' | FileNotFoundError: [Errno 2] No such file or directory: 'complaints.csv' | Pass |
13Results, limits and what next
- Each department has its own vocabulary, which is why complaints can be routed from words alone.
- Word profiles routed 90.9 % of testing complaints correctly, against 76.1 % for keyword rules.
- The keyword rules could not place 13 complaints, mostly ones written in Hindi.
- The word profiles learned paani, bijli, sadak and kachra from the data, with nobody telling them.
- The remaining mistakes are complaints that use another department's word — mostly Sanitation complaints that mention water.
What this model cannot do
- Made-up complaints, more regular than real ones
- Only four departments; a real city has many more
- Words are counted one at a time, so it cannot tell "water from a blocked drain" from "no water"
- A complaint about two problems at once can only go to one department
What to add next
This is where you make the project your own. Take one of these, or an idea of yours:
- Count word pairs such as "dirty water" and "no water", which mean different things
- Show the top two departments when their scores are close, for a person to choose
- Add more departments — parks, health, stray animals
- Collect anonymous complaints about your school and route them to the right staff member
What you may have to learn on your own
- Text classification with more than two classes, and reading a 4 × 4 confusion matrix
- Recall for each class
- How words shared between classes cause mistakes
- Why training data must include the way real people write, in every language they use
14Conclusion
The project built a model that reads a complaint and sends it to the right department. Learned word profiles routed 90.9 % of testing complaints correctly — well above the 76.1 % of hand-written keyword rules.
The biggest gain came from learning. Nobody told the model that bijli means electricity or kachra means garbage; it learned them from the training complaints. For a city where people write the way they speak, that matters more than any keyword list.
Its remaining mistakes have a clear cause — words shared between departments, read one at a time — and so a clear next step: look at pairs of words, and let a person check the complaints the model is unsure about.
15Questions for the viva
The project carries a viva voce of its own, worth 5 marks. These are the questions it is most likely to ask about this project. Try answering each one aloud before opening it.
▸How many classes does your model have?
Four: Water, Electricity, Roads and Sanitation.
▸How do the word profiles work?
For each department, the model learns what share of the words in its training complaints each word makes up. A new complaint is scored against each department by adding up its words' shares, and goes to the highest.
▸Why did the keyword rules fail on so many complaints?
Many were in Hindi typed in English letters, with words like bijli and kachra that were not in the keyword lists. Others contained another department's word.
▸Which department's complaints did your model get wrong most often, and why?
Sanitation complaints that mention water, like "dirty water from a blocked drain". The word water is strongly linked to the Water department.
▸Why did you add words like sector and ward to the stop words?
They appear in every department's complaints, so they do not help choose one.
▸What is recall for one class?
Of all the complaints that really belong to that department, the share the model sent to it.
▸Which SDGs does it relate to?
SDG 11, Sustainable Cities and Communities, and SDG 6, Clean Water and Sanitation.
16References
- Centralized Public Grievance Redress and Monitoring System (CPGRAMS), Government of India — https://pgportal.gov.in/
- Swachh Bharat Mission (Urban) — https://sbmurban.org/
- Orange Data Mining, Text add-on — https://orangedatamining.com/widget-catalog/text-mining/
- CBSE, Artificial Intelligence (Subject Code 417), Class X curriculum, 2026-27 — Part C, Practical and Project Work
- CBSE, Artificial Intelligence Facilitator Handbook, Class X
- pandas — https://pandas.pydata.org/docs/; NumPy — https://numpy.org/doc/; Matplotlib — https://matplotlib.org/stable/
- LambdaLab — https://www.lambdalab.in