Which Crop for This Field?
Soil nutrients, pH and rainfall in; the crop that suits the field out — a model that asks the five most similar fields what grew well there.
1Introduction
A farmer can get the soil tested. The report gives numbers: nitrogen, phosphorus, potassium and pH. But a sheet of numbers does not say what to sow. Reading it well needs an expert, and there are far more farmers than experts.
So many farmers sow what they sowed last year, or what the neighbour sows. If the crop does not suit the soil and the rainfall, the harvest is poor, and more fertiliser is used to make up for it.
This project asks: given a field's soil test and its weather, can a computer recommend a crop that suits it?
Zero Hunger
Life on Land
SDG 2 asks for more food from the land we already farm, by small farmers above all. A crop that suits the soil gives a better harvest with less fertiliser and less water. That also protects the soil for the next season, which is what SDG 15 is about.
The curriculum asks that the project be related to the Sustainable Development Goals. That link is the reason the problem is worth solving, so it belongs at the very start of the report, not tacked on at the end.
2Stage 1 — Problem Scoping
Problem scoping means understanding the problem properly before building anything. The tool for it is the 4Ws Problem Canvas: who has the problem, what the problem is, where it happens, and why solving it matters.
- Small farmers who have a soil test report
- Krishi Vigyan Kendra and agriculture department staff
- A soil test gives numbers, not a decision
- The wrong crop gives a poor harvest and wastes fertiliser and water
- Farms in villages with few agriculture experts
- At sowing time, when the decision has to be made quickly
- The right crop gives more food from the same field
- Less fertiliser is wasted and the soil stays healthy
The problem statement
The four answers are then joined into one sentence, using the curriculum's problem statement template:
A small farmer with a soil test report, or a Krishi Vigyan Kendra worker helping many farmers at once.
How it is done today
The government's Soil Health Card gives a farmer the soil test results and fertiliser advice. It is a big help, but the farmer still has to decide what to sow.
An agriculture officer can read the report and advise. There are few of them, and a farmer may have to travel and wait.
The most common way. It needs no help, but it ignores what the soil test says, and the same crop year after year can wear out the soil.
Objectives
- To read soil test results and weather for 500 fields from a CSV file
- To clean the data: remove repeated rows and missing readings, and make every crop name the same
- To find, with charts, which features separate one crop from another
- To build a k nearest neighbours model that recommends a crop
- To test it on fields it has never seen, and find which crops it mixes up
- To see how the number of neighbours (k) changes the result
- To recommend crops for new soil test cards
📘 Revise: Stage 1 — Problem Scoping
3Stage 2 — Data Acquisition
Each row of the file is one field. It holds the field's soil test (nitrogen, phosphorus and potassium in kg per hectare, and pH), the average rainfall and temperature of the growing season, and the crop that grew well there. That last column is the label.
The file has 503 rows. They cover five crops: rice, wheat, maize, chickpea and cotton.
For a real project, soil test results can be collected from farmers' Soil Health Cards (with their permission), and rainfall and temperature from the India Meteorological Department. Public crop recommendation datasets can also be found on open data websites — if you use one, give its link in your report.
Features and label
The features are what the model is given. The label is the answer it has to learn to give.
| Column | Type | What it holds | Role |
|---|---|---|---|
nitrogen | integer | Nitrogen (N) in the soil, kg per hectare | feature |
phosphorus | integer | Phosphorus (P) in the soil, kg per hectare | feature |
potassium | integer | Potassium (K) in the soil, kg per hectare | feature |
ph | decimal | How acidic or alkaline the soil is (7 is neutral) | feature |
rainfall_mm | decimal | Average rainfall per month in the growing season, mm | feature |
temperature_c | decimal | Average temperature in the growing season, °C | feature |
crop | text | The crop that grew well in this field — what the model must recommend | label |
sample_no | text | An ID for the soil sample. No farmer's name is stored. | not used |
The first eight rows of soil_samples.csv
| sample_no | nitrogen | phosphorus | potassium | ph | rainfall_mm | temperature_c | crop |
|---|---|---|---|---|---|---|---|
S1001 | 89 | 63 | 43 | 6.8 | 69.9 | 18.4 | Wheat |
S1002 | 57 | 65 | 83 | 7.2 | 76.8 | 16.4 | Chickpea |
S1003 | 23 | 67 | 79 | 7.1 | 71.3 | 19.4 | Chickpea |
S1004 | 44 | 59 | 78 | 7.5 | 79.4 | 19.4 | Chickpea |
S1005 | 111 | 49 | 39 | 6.9 | 60.7 | 14.4 | Wheat |
S1006 | 95 | 48 | 46 | 6.9 | 72.7 | 18.5 | Wheat |
S1006 | 95 | 48 | 46 | 6.9 | 72.7 | 18.5 | Wheat |
S1007 | 107 | 35 | 42 | 6.9 | 81.0 | 19.1 | Wheat |
Inside soil_samples.csv
Five hundred fields, each with its soil test, its weather and the crop that grew well there. It has the mistakes real typed data has. The whole file is 503 rows, 17.8 KB. It comes with the project download, and you can take the file on its own.
📘 Revise: Stage 2 — Data Acquisition
4Stage 3 — Data Exploration
Data exploration means getting to know the data before trusting it: fixing what is wrong with it, then drawing it to see the patterns. The charts here are what decide what the model should be.
What was wrong with the data
drop_duplicates() removes an exact repeat. Left in, that field would get two votes when the model asks its neighbours.
The rows are removed and counted. Guessing a pH would invent a soil test nobody did.
strip() removes the spaces and title() makes the capitals the same. Without this, "rice" and "Rice" would be two different crops.
Each feature is rescaled to run from 0 to 1 before fields are compared, so rainfall does not decide everything just because its numbers are bigger.
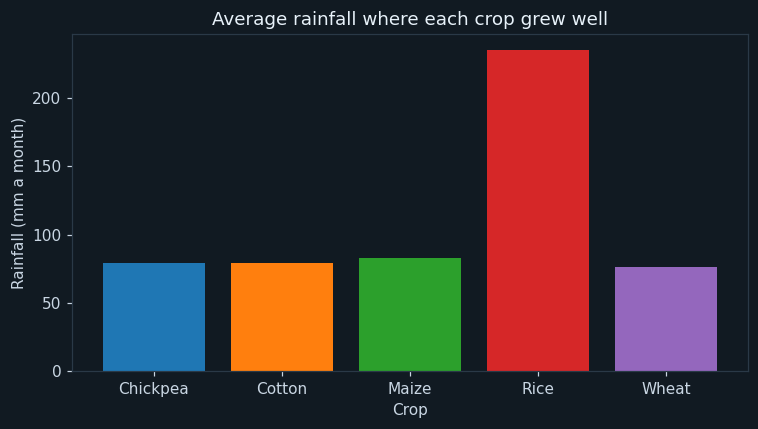
One bar per crop. The height is the average rainfall of the fields where that crop grew well.
Rice stands far above the rest, at about three times the rainfall of any other crop. Rainfall alone picks out rice. The other four crops all grew with similar rain, so something else must tell them apart.
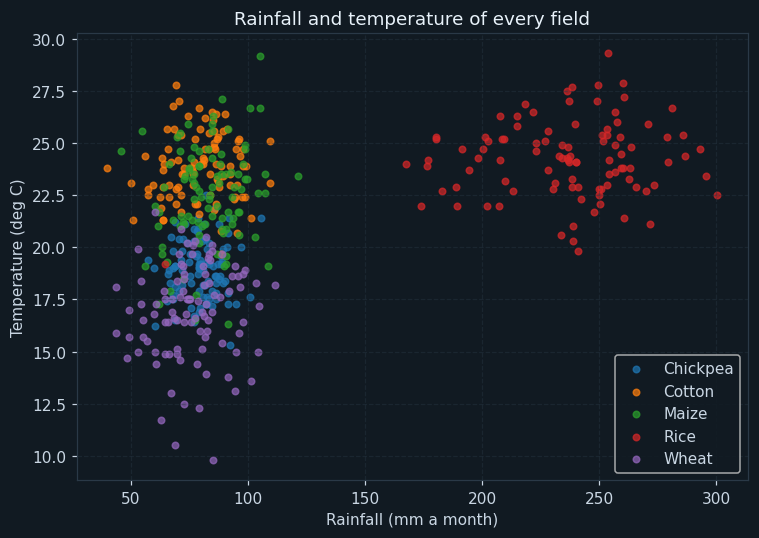
Each dot is one field: rainfall across, temperature up, coloured by its crop.
Rice sits alone on the right. Wheat sits low, in the coolest fields — it is a winter crop. Chickpea, maize and cotton overlap in the middle, so the weather cannot separate them. The soil has to.
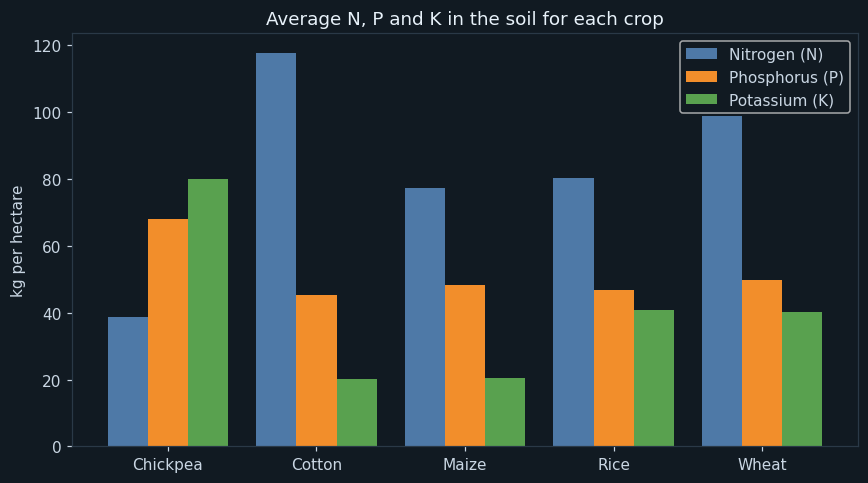
Three bars for each crop: the average nitrogen, phosphorus and potassium in its soil.
This is where the middle group comes apart. Chickpea grows with little nitrogen but a lot of potassium — it is a pulse, and pulses add their own nitrogen to the soil. Cotton has the most nitrogen of all. Maize and cotton look alike in phosphorus and potassium, so these two are the pair to watch in the evaluation.
📘 Revise: Stage 3 — Data Exploration
5Stage 4 — Modelling
Where this model sits in the family of AI models:
The answer is one of five crops, so this is classification. Every field in the data comes with the crop that grew well, so the model learns from labelled examples: supervised learning.
How the model works
The data is shuffled and split into 396 training fields and 100 testing fields.
The model is called k nearest neighbours, and it works the way a farmer might ask around. To recommend a crop for a new field, it measures how close that field's soil and weather are to every training field. It takes the 5 closest — the 5 nearest neighbours — and recommends the crop most of them grew.
Before measuring how close two fields are, every feature is rescaled to run from 0 to 1. Otherwise a difference of 50 mm of rain would count for far more than a difference of 1 in pH, though the pH difference matters more to the crop.
📘 Revise: Stage 4 — Modelling
6Stage 5 — Evaluation
On the 100 testing fields the model got 97 of 100 right — an accuracy of 97.0 %.
The confusion matrix shows where the mistakes are, and precision and recall per crop say how bad each one is. Maize has the lowest recall, 86.7%: of the 15 maize fields, two were recommended cotton. For a farmer that is the mistake that matters — sowing cotton where maize would do better.
Which number matters most? Here a wrong recommendation of any kind costs a farmer a season. So overall accuracy is a fair summary, but the per-crop recall is what the report should be honest about: the model is very reliable for rice, wheat and chickpea, and less sure between maize and cotton.
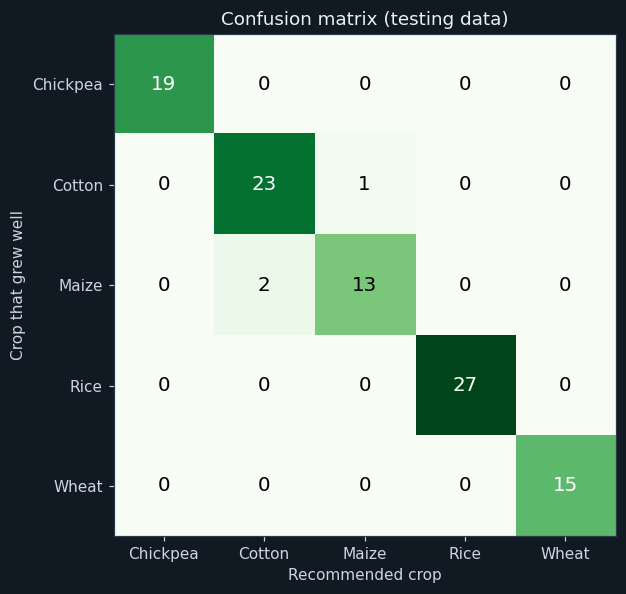
Rows are the crop that really grew well. Columns are the crop the model recommended. The diagonal holds the correct answers.
Rice, wheat and chickpea were never wrong. All three mistakes are between maize and cotton — the same pair chart 3 warned about. The model is not making random errors; it is struggling exactly where the data overlaps.
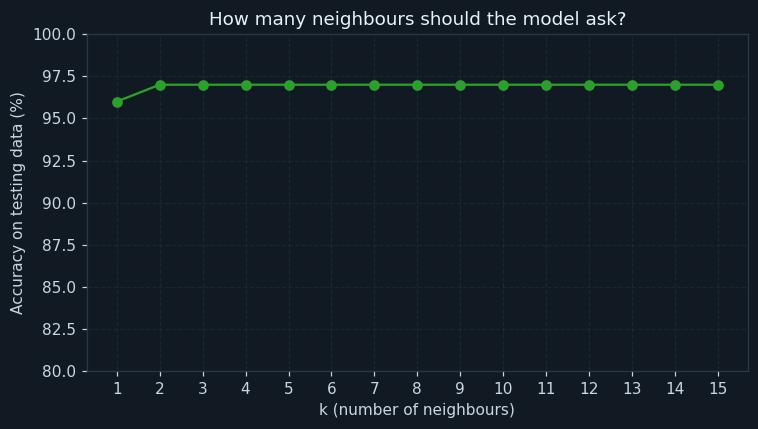
Across is k, the number of neighbours asked. Up is the accuracy on the testing fields for that k.
Asking only one neighbour (k = 1) gave 96.0 %. One unusual field can mislead it. From about three neighbours the line levels out and stays high, so k = 5 is a safe choice — enough neighbours to outvote one odd field.
📘 Revise: The Confusion Matrix
7Stage 6 — Deployment
The program ends by reading three new soil test cards and recommending a crop for each. With each answer it prints how many of the 5 neighbours agreed. 5 of 5 means the model is sure; 3 of 5 means the field is near a boundary and an expert should look.
In real use this could sit inside a Krishi Vigyan Kendra: the soil test is typed in and the recommendation is printed on the farmer's card, with the agreement count beside it.
📘 Revise: Stage 6 — Deployment
8Ethical concerns
An AI project is not finished when the model works. The curriculum asks three questions of every model — is it fair (bias), can it explain itself (transparency), and who answers for its mistakes (accountability). For this project:
The model recommends; the farmer decides. If it is wrong, the farmer loses a season, not the computer. That is why it prints how sure it is, and why an expert should check any field where the neighbours disagree. This is accountability.
The model only knows five crops and the conditions in its data. A field with a soil the data never saw — very acidic, or very salty — will still get one of the five crops, even if none suits it. The report must say this.
Soil tests belong to the farmers who paid for them. A real dataset should use sample numbers, never names, and be collected with permission.
📘 Revise: Bias, Transparency, Accountability
9Source code
The whole program — it is also in the downloads at the top of this page — in Python with pandas, NumPy and matplotlib — the three libraries of Unit 7. It is laid out as the six stages of the AI Project Cycle, one after another. Every chart on this page was drawn by it, and every number came out of running it.
# ---------------------------------------------------------------------------
# crop_recommendation.py
#
# AI project on Statistical Data: recommending a crop for a field from its
# soil test and its weather.
#
# CBSE Class X, Artificial Intelligence (417), Part C project work.
# SDG 2 (Zero Hunger) and SDG 15 (Life on Land).
#
# The program follows the six stages of the AI Project Cycle. The model is
# "k nearest neighbours": to recommend a crop for a new field, it finds the
# k fields in the training data whose soil and weather are most like it, and
# recommends the crop that most of those neighbours grew well.
#
# Libraries: pandas (the data), numpy (the arithmetic), matplotlib (charts).
# ---------------------------------------------------------------------------

# %% Stage 1 - Problem scoping
print("=" * 60)
print("CROP RECOMMENDATION FROM A SOIL TEST")
print("=" * 60)
print("Who   : small farmers deciding what to sow")
print("What  : the wrong crop for the soil means a poor harvest")
print("Where : farms that have a soil test but no expert to read it")
print("Why   : the right crop gives more food from the same land")
print()

# %% Stage 2 - Data acquisition
import pandas as pd
import numpy as np
import matplotlib.pyplot as plt

pd.set_option("display.width", 120)
pd.set_option("display.max_columns", 20)

data = pd.read_csv("soil_samples.csv")

print("--- Stage 2: Data acquisition ---")
print("Rows read    :", len(data))
print("Columns read :", len(data.columns))
print()
print("The first 10 rows:")
print(data.head(10))
print()

# %% Stage 3 - Data exploration
print("--- Stage 3: Data exploration ---")

features = ["nitrogen", "phosphorus", "potassium", "ph", "rainfall_mm", "temperature_c"]
label = "crop"

# The same sample typed in twice would count twice, so repeats are removed.
before = len(data)
data = data.drop_duplicates()
print("Repeated rows removed        :", before - len(data))

# A soil test with a reading missing cannot be compared with other fields.
missing = data[features].isnull().any(axis=1).sum()
data = data.dropna(subset=features)
print("Rows with a reading missing  :", missing, "(removed)")

# "rice", " RICE" and "Rice" must all be one crop.
data[label] = data[label].str.strip().str.title()
print("Rows left                    :", len(data))
print()

crops = sorted(data[label].unique())
print("Fields of each crop:")
print(data[label].value_counts().sort_index())
print()

rain = data["rainfall_mm"]
print("Rainfall - mean   :", round(np.mean(rain), 1), "mm")
print("Rainfall - median :", round(np.median(rain), 1), "mm")
print()

averages_by_crop = data.groupby(label)[features].mean().round(1)
print("The average field for each crop:")
print(averages_by_crop)
print()

colours = ["#1f77b4", "#ff7f0e", "#2ca02c", "#d62728", "#9467bd"]

# Chart 1: average rainfall for each crop.
plt.figure(figsize=(7, 4))
plt.bar(crops, averages_by_crop["rainfall_mm"], color=colours)
plt.title("Average rainfall where each crop grew well")
plt.xlabel("Crop")
plt.ylabel("Rainfall (mm a month)")
plt.tight_layout()
plt.savefig("chart1_rainfall.png")
plt.close()

# Chart 2: rainfall against temperature, one colour per crop.
plt.figure(figsize=(7, 5))
for i in range(len(crops)):
    rows = data[data[label] == crops[i]]
    plt.scatter(rows["rainfall_mm"], rows["temperature_c"],
                color=colours[i], label=crops[i], alpha=0.7, s=18)
plt.title("Rainfall and temperature of every field")
plt.xlabel("Rainfall (mm a month)")
plt.ylabel("Temperature (deg C)")
plt.legend()
plt.grid(True, linestyle="--", alpha=0.4)
plt.tight_layout()
plt.savefig("chart2_rain_temperature.png")
plt.close()

# Chart 3: the three nutrients, side by side for each crop.
x = np.arange(len(crops))
plt.figure(figsize=(8, 4.5))
plt.bar(x - 0.27, averages_by_crop["nitrogen"], width=0.27, label="Nitrogen (N)", color="#4e79a7")
plt.bar(x, averages_by_crop["phosphorus"], width=0.27, label="Phosphorus (P)", color="#f28e2b")
plt.bar(x + 0.27, averages_by_crop["potassium"], width=0.27, label="Potassium (K)", color="#59a14f")
plt.xticks(x, crops)
plt.title("Average N, P and K in the soil for each crop")
plt.ylabel("kg per hectare")
plt.legend()
plt.tight_layout()
plt.savefig("chart3_npk.png")
plt.close()

# %% Stage 4 - Modelling
print("--- Stage 4: Modelling ---")

# Train-test split: shuffle (the same way every run), then 80% / 20%.
data = data.sample(frac=1, random_state=3)
cut = int(len(data) * 0.8)
train = data[:cut]
test = data[cut:]
print("Training rows :", len(train))
print("Testing rows  :", len(test))

# Rainfall runs into hundreds and pH stays under 10. Each feature is rescaled
# to run from 0 to 1 (using the training data only), so that no feature wins
# just because its numbers are bigger.
low = train[features].min()
high = train[features].max()
train_scaled = (train[features] - low) / (high - low)
test_scaled = (test[features] - low) / (high - low)

k = 5
print("Neighbours asked (k) :", k)
print()

predictions = []
for i in range(len(test)):
    row = test_scaled.iloc[i]
    # Distance from this field to EVERY training field.
    distance = ((train_scaled - row) ** 2).sum(axis=1)
    # The k closest fields, and the crop most of them grew.
    nearest = distance.nsmallest(k).index
    predictions.append(train.loc[nearest, label].mode()[0])

# %% Stage 5 - Evaluation
print("--- Stage 5: Evaluation ---")
actual = list(test[label])

correct = 0
for i in range(len(actual)):
    if predictions[i] == actual[i]:
        correct = correct + 1
accuracy = correct / len(actual) * 100
print("Correct recommendations :", correct, "of", len(actual))
print("Accuracy                :", round(accuracy, 1), "%")
print()

matrix = pd.crosstab(pd.Series(actual, name="Actual"),
                     pd.Series(predictions, name="Predicted"))
matrix = matrix.reindex(index=crops, columns=crops, fill_value=0)
print("Confusion matrix:")
print(matrix)
print()

print("Crop        Precision   Recall")
for c in crops:
    tp = matrix.loc[c, c]
    if matrix[c].sum() > 0:
        precision = tp / matrix[c].sum() * 100
    else:
        precision = 0
    if matrix.loc[c].sum() > 0:
        recall = tp / matrix.loc[c].sum() * 100
    else:
        recall = 0
    print(c.ljust(10), str(round(precision, 1)).rjust(9), "%", str(round(recall, 1)).rjust(7), "%")
print()

# Chart 4: the confusion matrix.
plt.figure(figsize=(6.5, 5.5))
plt.imshow(matrix.values, cmap="Greens")
for r in range(len(crops)):
    for c in range(len(crops)):
        value = matrix.values[r][c]
        if value > matrix.values.max() / 2:
            ink = "white"
        else:
            ink = "black"
        plt.text(c, r, value, ha="center", va="center", fontsize=13, color=ink)
plt.xticks(range(len(crops)), crops)
plt.yticks(range(len(crops)), crops)
plt.xlabel("Recommended crop")
plt.ylabel("Crop that grew well")
plt.title("Confusion matrix (testing data)")
plt.tight_layout()
plt.savefig("chart4_confusion_matrix.png")
plt.close()

# How much does the choice of k matter? Try every k from 1 to 15.
k_values = list(range(1, 16))
k_accuracy = []
for kk in k_values:
    right = 0
    for i in range(len(test)):
        distance = ((train_scaled - test_scaled.iloc[i]) ** 2).sum(axis=1)
        nearest = distance.nsmallest(kk).index
        if train.loc[nearest, label].mode()[0] == actual[i]:
            right = right + 1
    k_accuracy.append(right / len(test) * 100)

print("Accuracy for k = 1 :", round(k_accuracy[0], 1), "%")
print("Accuracy for k = 5 :", round(k_accuracy[4], 1), "%")
print("Accuracy for k = 15 :", round(k_accuracy[14], 1), "%")
print()

# Chart 5: accuracy for each value of k.
plt.figure(figsize=(7, 4))
plt.plot(k_values, k_accuracy, marker="o", color="#2ca02c")
plt.title("How many neighbours should the model ask?")
plt.xlabel("k (number of neighbours)")
plt.ylabel("Accuracy on testing data (%)")
plt.xticks(k_values)
plt.ylim(80, 100)
plt.grid(True, linestyle="--", alpha=0.4)
plt.tight_layout()
plt.savefig("chart5_choosing_k.png")
plt.close()

# %% Stage 6 - Deployment
print("--- Stage 6: Deployment ---")
print("Three new soil test cards:")

new_fields = pd.DataFrame({
    "nitrogen":      [85, 38, 120],
    "phosphorus":    [45, 70, 44],
    "potassium":     [41, 79, 19],
    "ph":            [6.2, 7.4, 7.1],
    "rainfall_mm":   [240, 78, 82],
    "temperature_c": [25, 19, 24],
})
new_scaled = (new_fields - low) / (high - low)

for i in range(len(new_fields)):
    distance = ((train_scaled - new_scaled.iloc[i]) ** 2).sum(axis=1)
    nearest = distance.nsmallest(k).index
    votes = train.loc[nearest, label]
    best = votes.mode()[0]
    agree = (votes == best).sum()
    f = new_fields.iloc[i]
    print("N", int(f["nitrogen"]), " P", int(f["phosphorus"]), " K", int(f["potassium"]),
          " pH", f["ph"], " rain", f["rainfall_mm"], "mm  ->", best,
          "(" + str(agree), "of", k, "neighbours agree)")
The library calls it is built from
| Call | Where | What it does |
|---|---|---|
pd.read_csv() | Stage 2 | Reads the CSV file into a table |
drop_duplicates() | Stage 3 | Removes rows typed in twice |
dropna(subset=...) | Stage 3 | Removes rows with a reading missing |
str.strip().str.title() | Stage 3 | Makes "rice " and "RICE" into Rice |
groupby(...).mean() | Stage 3 | The average field for each crop |
plt.bar / plt.scatter / plt.plot | Stages 3, 5 | Bar charts, a scatter plot and a line chart |
sample(frac=1, random_state=3) | Stage 4 | Shuffles the rows the same way every run |
(x - low) / (high - low) | Stage 4 | Rescales a feature to run from 0 to 1 |
nsmallest(k).index | Stage 4 | Finds the k closest training fields |
mode()[0] | Stage 4 | The crop most of the neighbours grew |
pd.crosstab() | Stage 5 | Builds the confusion matrix |
plt.imshow / plt.text | Stage 5 | Draws the confusion matrix |
10Sample output
A real run, exactly as it appeared. Nothing below was typed by hand.
============================================================
CROP RECOMMENDATION FROM A SOIL TEST
============================================================
Who   : small farmers deciding what to sow
What  : the wrong crop for the soil means a poor harvest
Where : farms that have a soil test but no expert to read it
Why   : the right crop gives more food from the same land

--- Stage 2: Data acquisition ---
Rows read    : 503
Columns read : 8

The first 10 rows:
  sample_no  nitrogen  phosphorus  potassium   ph  rainfall_mm  temperature_c      crop
0     S1001        89          63         43  6.8         69.9           18.4     Wheat
1     S1002        57          65         83  7.2         76.8           16.4  Chickpea
2     S1003        23          67         79  7.1         71.3           19.4  Chickpea
3     S1004        44          59         78  7.5         79.4           19.4  Chickpea
4     S1005       111          49         39  6.9         60.7           14.4     Wheat
5     S1006        95          48         46  6.9         72.7           18.5     Wheat
6     S1006        95          48         46  6.9         72.7           18.5     Wheat
7     S1007       107          35         42  6.9         81.0           19.1     Wheat
8     S1008        78          41         38  7.8         54.2           17.3     Wheat
9     S1009       100          49         42  6.6        194.4           23.7      Rice

--- Stage 3: Data exploration ---
Repeated rows removed        : 3
Rows with a reading missing  : 4 (removed)
Rows left                    : 496

Fields of each crop:
crop
Chickpea     97
Cotton       99
Maize       101
Rice         99
Wheat       100
Name: count, dtype: int64

Rainfall - mean   : 110.6 mm
Rainfall - median : 83.5 mm

The average field for each crop:
          nitrogen  phosphorus  potassium   ph  rainfall_mm  temperature_c
crop
Chickpea      38.6        68.0       80.1  7.1         79.6           19.0
Cotton       117.8        45.4       20.1  7.0         79.4           23.8
Maize         77.2        48.4       20.4  6.2         83.0           22.5
Rice          80.2        46.9       40.7  6.3        235.2           24.2
Wheat         99.0        49.8       40.2  6.9         76.0           16.9

--- Stage 4: Modelling ---
Training rows : 396
Testing rows  : 100
Neighbours asked (k) : 5

--- Stage 5: Evaluation ---
Correct recommendations : 97 of 100
Accuracy                : 97.0 %

Confusion matrix:
Predicted  Chickpea  Cotton  Maize  Rice  Wheat
Actual
Chickpea         19       0      0     0      0
Cotton            0      23      1     0      0
Maize             0       2     13     0      0
Rice              0       0      0    27      0
Wheat             0       0      0     0     15

Crop        Precision   Recall
Chickpea       100.0 %   100.0 %
Cotton          92.0 %    95.8 %
Maize           92.9 %    86.7 %
Rice           100.0 %   100.0 %
Wheat          100.0 %   100.0 %

Accuracy for k = 1 : 96.0 %
Accuracy for k = 5 : 97.0 %
Accuracy for k = 15 : 97.0 %

--- Stage 6: Deployment ---
Three new soil test cards:
N 85  P 45  K 41  pH 6.2  rain 240.0 mm  -> Rice (5 of 5 neighbours agree)
N 38  P 70  K 79  pH 7.4  rain 78.0 mm  -> Chickpea (5 of 5 neighbours agree)
N 120 P 44 K 19 pH 7.1 rain 82.0 mm -> Cotton (5 of 5 neighbours agree)11The same project without code
The curriculum's Statistical Data unit uses Orange, and its kNN widget is the same idea as this program: ask the nearest neighbours. The tool is Orange Data Mining.
Load soil_samples.csv. Set crop as the target and sample_no as a meta attribute, so it is not used as a feature.
Check the rows and spot the repeats and blanks.
Remove rows with missing values, and normalise the features to the 0–1 range.
Choose rainfall_mm and split it by crop to see rice stand apart — the same finding as chart 1.
Keep 80% for training; the remaining 20% is the testing data.
Set the number of neighbours to 5. This is the model.
Test on the testing data and read the accuracy (CA), precision and recall.
See which crops are mixed up — it should again be maize and cotton.
📘 Revise: No-Code AI, and Orange
12Testing
Every case below was actually run, and the result is what came back. Each one gives the whole program a small input of its own.
| Test case | Expected | Actual | Result |
|---|---|---|---|
| The full dataset | Rows read : 503 | Rows read : 503 | Pass |
| Three rows typed in twice are removed | Repeated rows removed : 3 | Repeated rows removed : 3 | Pass |
| Four soil tests with no pH are removed | Rows with a reading missing : 4 (removed) | Rows with a reading missing : 4 (removed) | Pass |
| rice, " WHEAT" and "maize " join their crops: still five crops | Correct recommendations : 97 of 100 | Correct recommendations : 97 of 100 | Pass |
| Two crops with nothing in common: every recommendation right | Accuracy : 100.0 % | Accuracy : 100.0 % | Pass |
| One row pasted twice is counted once | Repeated rows removed : 1 | Repeated rows removed : 1 | Pass |
| "rice " is cleaned to Rice, so it does not become a sixth crop | Accuracy : 100.0 % | Accuracy : 100.0 % | Pass |
| A soil test with the pH left blank is removed | Rows with a reading missing : 1 (removed) | Rows with a reading missing : 1 (removed) | Pass |
| The data file is missing | FileNotFoundError: [Errno 2] No such file or directory: 'soil_samples.csv' | FileNotFoundError: [Errno 2] No such file or directory: 'soil_samples.csv' | Pass |
13Results, limits and what next
- The model recommended the right crop for 97 of 100 testing fields — an accuracy of 97.0 %.
- Rainfall alone separates rice; temperature separates wheat, a winter crop.
- Chickpea stands out by its soil: little nitrogen, a lot of potassium.
- Every mistake was between maize and cotton, whose soils are most alike.
- Asking one neighbour is less reliable than asking five.
What this model cannot do
- It knows only five crops
- It does not know the market price, so it cannot say which crop will earn the most
- Rainfall is a season's average; a late monsoon is not part of the data
- A field unlike any in the data still gets one of the five crops
What to add next
This is where you make the project your own. Take one of these, or an idea of yours:
- Add more crops, and a sixth feature such as humidity
- Print "ask an expert" whenever fewer than 4 of the 5 neighbours agree
- Collect real soil test results from your area, with permission, and retrain
- Add the expected market price, so the farmer sees the likely earnings too
What you may have to learn on your own
- What k nearest neighbours does, and why the features must be rescaled first
- Reading a 5 × 5 confusion matrix
- What N, P, K and pH mean for a crop — a short talk with an agriculture teacher helps
- Building the same workflow with Orange's kNN widget
14Conclusion
The project shows that a soil test and the season's weather are enough to recommend a suitable crop most of the time. The model was right for 97 of 100 testing fields.
Data exploration did more than draw pictures. The three charts showed which features separate which crops, and they predicted the one place the model would struggle — maize and cotton — before the model was built.
A model like this should help a farmer, not replace advice. Printing how many neighbours agreed turns a single answer into an answer with a level of confidence, which is what a farmer needs to decide.
15Questions for the viva
The project carries a viva voce of its own, worth 5 marks. These are the questions it is most likely to ask about this project. Try answering each one aloud before opening it.
▸What are the features and the label in your project?
The features are nitrogen, phosphorus, potassium, pH, rainfall and temperature. The label is the crop.
▸Explain k nearest neighbours in simple words.
To recommend a crop for a new field, the model finds the k training fields most similar to it and recommends the crop that most of them grew.
▸Why did you rescale the features?
Rainfall is in hundreds and pH is under 10. Without rescaling, rainfall would decide the distance on its own just because its numbers are bigger.
▸Why did you choose k = 5?
With k = 1, one unusual field can mislead the model. The line chart showed that accuracy levels out from about three neighbours, so five is a safe choice.
▸Which crops did your model confuse, and why?
Maize and cotton, because their soil and weather are the most alike in the data.
▸Is your project supervised or unsupervised learning?
Supervised, because every field in the training data comes with the crop that grew well — the label.
▸Which SDG does it relate to?
SDG 2, Zero Hunger, because the right crop gives more food from the same land, and SDG 15, Life on Land, because it reduces wasted fertiliser.
16References
- Soil Health Card scheme, Department of Agriculture and Farmers Welfare, Government of India — https://soilhealth.dac.gov.in/
- India Meteorological Department — https://mausam.imd.gov.in/
- Orange Data Mining, kNN widget — https://orangedatamining.com/widget-catalog/model/knn/
- CBSE, Artificial Intelligence (Subject Code 417), Class X curriculum, 2026-27 — Part C, Practical and Project Work
- CBSE, Artificial Intelligence Facilitator Handbook, Class X
- pandas — https://pandas.pydata.org/docs/; NumPy — https://numpy.org/doc/; Matplotlib — https://matplotlib.org/stable/
- LambdaLab — https://www.lambdalab.in