Which Penguin Is This?
Four measurements, three species, and a model that tells them apart — the curriculum's own Statistical Data project, done on the real Palmer Penguins data.
1Introduction
Three kinds of penguin live on the islands near Palmer Station in Antarctica: Adelie, Chinstrap and Gentoo. From a distance they look alike. Telling them apart is a job for somebody trained, and there are never enough trained people at a colony.
A volunteer can still measure a penguin. A bill can be measured with a ruler, a flipper with a tape, and a penguin can be weighed. The question this project asks is simple: are those four numbers enough for a computer to say which species the penguin is?
This is the sample project the CBSE curriculum itself names for Statistical Data. It uses the same real dataset, and it is done here in Python so that every number can be checked.
Life below Water
Climate Action
Penguins feed at sea, so the number of each species is a signal of how healthy the ocean around them is. The Antarctic Peninsula, where this data was collected, is one of the fastest-warming places on Earth. Counting each species, year after year, is how scientists see which ones are coping and which are not.
The curriculum asks that the project be related to the Sustainable Development Goals. That link is the reason the problem is worth solving, so it belongs at the very start of the report, not tacked on at the end.
2Stage 1 — Problem Scoping
Problem scoping means understanding the problem properly before building anything. The tool for it is the 4Ws Problem Canvas: who has the problem, what the problem is, where it happens, and why solving it matters.
- Field scientists studying the penguin colonies
- Volunteers who measure birds but cannot tell the species apart
- Three species look alike, and naming them correctly needs an expert
- Wrong species counts give a wrong picture of how each species is doing
- Three islands near Palmer Station, Antarctica
- During the breeding season, when the birds are measured
- Measurements can be taken by anyone, so more birds can be counted
- Correct counts show which species are under pressure from a warming ocean
The problem statement
The four answers are then joined into one sentence, using the curriculum's problem statement template:
Field scientists and volunteers who count penguins at a breeding colony, and anybody who has to sort a large number of measurements by species.
How it is done today
This is the most reliable way, but there are only a few experts and thousands of birds. It does not grow with the size of the colony.
Guides describe colour and markings. They help, but a volunteer still has to judge with their eyes, and two volunteers can judge the same bird differently.
Always right, but slow and expensive. It is used to check a few birds, not to sort every bird measured in a season.
Objectives
- To read the real Palmer Penguins dataset from a CSV file and look at it
- To remove the rows that cannot be used, and say how many there were
- To explore the data with charts and find which measurements separate the species
- To build a rule based model from what the charts show
- To build a learning based model that finds the pattern on its own
- To test both models on penguins they have never seen, using a confusion matrix, accuracy, precision and recall
- To use the better model to name the species of new penguins
📘 Revise: Stage 1 — Problem Scoping
3Stage 2 — Data Acquisition
The data is real. It was collected by Dr Kristen Gorman and the Palmer Station Long Term Ecological Research programme, Antarctica, between 2007 and 2009. It was later published as the palmerpenguins dataset, which is free for anyone to use (it carries a CC0 licence). The CBSE curriculum uses the same dataset for its Orange Data Mining case study.
The file has 344 rows, one for each penguin, and 8 columns. Four of the columns are measurements: bill length, bill depth, flipper length and body mass. The species column is the answer.
Because this is somebody else's data, the report must say whose it is. The References section gives the scientists' paper and the dataset's address. If you do this project, you must do the same — or better still, collect measurements of your own. A version of this project could sort leaves by tree, or eggs by size, using data you measure yourself.
Features and label
The features are what the model is given. The label is the answer it has to learn to give.
| Column | Type | What it holds | Role |
|---|---|---|---|
bill_length_mm | decimal | Length of the bill (beak), in millimetres | feature |
bill_depth_mm | decimal | How tall the bill is, from top to bottom, in millimetres | feature |
flipper_length_mm | decimal | Length of the flipper (wing), in millimetres | feature |
body_mass_g | decimal | Weight of the penguin, in grams | feature |
species | text | Adelie, Chinstrap or Gentoo — what the model must predict | label |
island | text | Which of the three islands the bird was found on | not used |
sex | text | male or female; missing for some birds | not used |
year | integer | 2007, 2008 or 2009 | not used |
The first eight rows of penguins.csv
| species | island | bill_length_mm | bill_depth_mm | flipper_length_mm | body_mass_g | sex | year |
|---|---|---|---|---|---|---|---|
Adelie | Torgersen | 39.1 | 18.7 | 181 | 3750 | male | 2007 |
Adelie | Torgersen | 39.5 | 17.4 | 186 | 3800 | female | 2007 |
Adelie | Torgersen | 40.3 | 18 | 195 | 3250 | female | 2007 |
Adelie | Torgersen | NA | NA | NA | NA | NA | 2007 |
Adelie | Torgersen | 36.7 | 19.3 | 193 | 3450 | female | 2007 |
Adelie | Torgersen | 39.3 | 20.6 | 190 | 3650 | male | 2007 |
Adelie | Torgersen | 38.9 | 17.8 | 181 | 3625 | female | 2007 |
Adelie | Torgersen | 39.2 | 19.6 | 195 | 4675 | male | 2007 |
Inside penguins.csv
The real Palmer Penguins data, exactly as it is published. Two rows have no measurements at all, and the program has to deal with them. The whole file is 344 rows, 14.9 KB. It comes with the project download, and you can take the file on its own.
📘 Revise: Stage 2 — Data Acquisition
4Stage 3 — Data Exploration
Data exploration means getting to know the data before trusting it: fixing what is wrong with it, then drawing it to see the patterns. The charts here are what decide what the model should be.
What was wrong with the data
These birds were seen but never measured. A model cannot compare a bird with nothing, so the rows are removed and the count is printed. Filling the gaps with an average would invent a penguin that was never there.
Left alone. The model does not use the sex column, so dropping these birds would throw away good measurements for no reason.
Before the learning based model compares penguins, each measurement is rescaled to run from 0 to 1. Without this, body mass would decide everything just because its numbers are bigger.
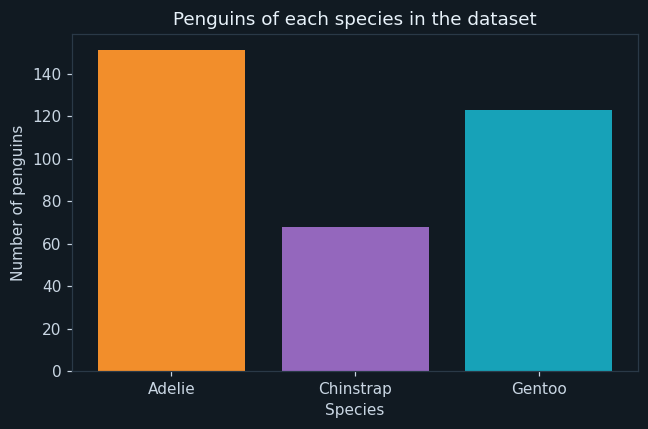
One bar per species. The height is how many penguins of that species are in the data. A bar chart is right here because the species are separate groups with no order.
There are more than twice as many Adelie as Chinstrap. This matters for the model: it sees fewer Chinstrap while it learns, so Chinstrap is the species it is most likely to get wrong. The evaluation stage checks whether that happened.
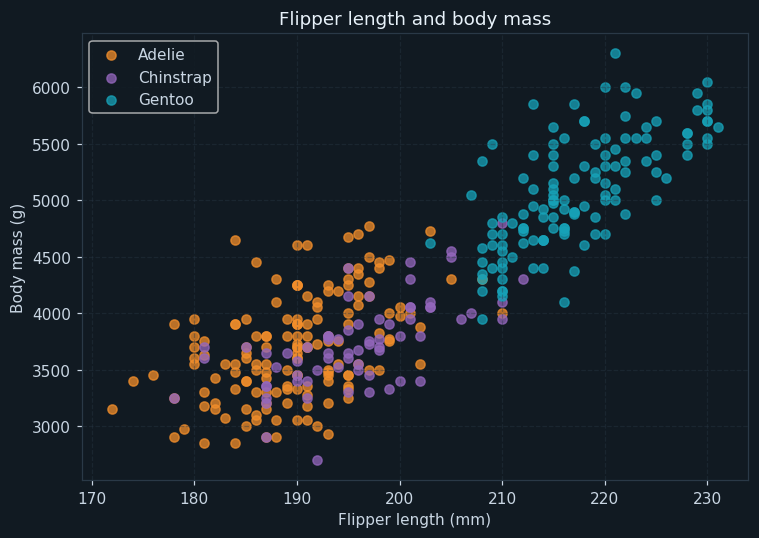
Each dot is one penguin. Its position shows its flipper length (across) and its body mass (up). The colour is its real species. A scatter plot is used because it shows two numbers about each penguin at once.
The Gentoo, in blue, sit in a group of their own at the top right: longer flippers and heavier bodies. Any Gentoo can be picked out with one line drawn at about 206 mm of flipper.
The Adelie and Chinstrap dots lie on top of each other. These two measurements cannot tell them apart. Something else is needed.
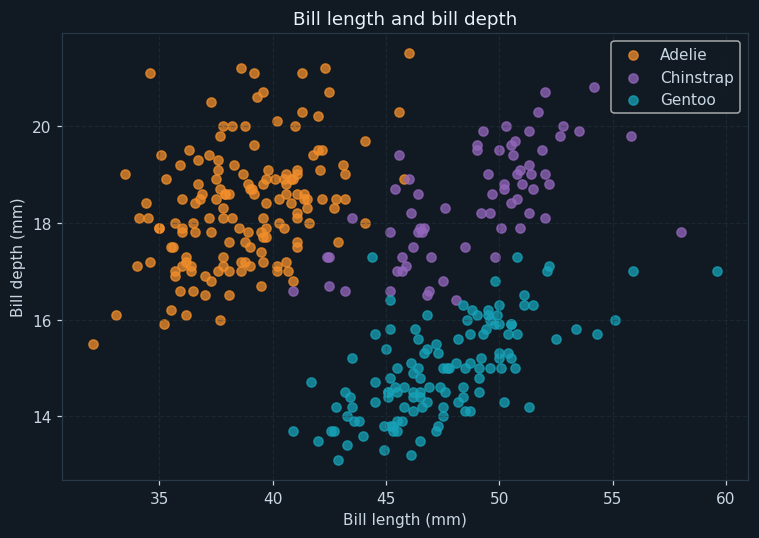
The same kind of chart, now using the two bill measurements.
This chart solves the problem the last one left. Chinstrap have long bills and Adelie have short ones, so bill length separates them — though not perfectly, because a few birds sit in the overlap around 44 mm.
Between them, the two charts give the rules for the rule based model: a long flipper means Gentoo, and of the rest, a long bill means Chinstrap. This is Data Exploration doing its job — the charts told us what to build.
📘 Revise: Stage 3 — Data Exploration
5Stage 4 — Modelling
Where this model sits in the family of AI models:
The answer is one of three fixed groups — Adelie, Chinstrap or Gentoo — so this is a classification problem.
Every penguin in the data already has its species written beside it. A model that learns from examples that come with the right answer is supervised learning.
How the model works
First the rows are shuffled and split: 273 penguins (80%) to train on and 69 (20%) kept aside for testing. The model never sees the testing penguins while it is being built. That is what makes the test fair.
The rule based model is two if-statements written by hand from the charts: a flipper of 206 mm or more means Gentoo; otherwise a bill of 44 mm or more means Chinstrap; otherwise Adelie.
The learning based model works out the average penguin of each species from the training data — its average bill, flipper and mass. To name a new penguin, it measures how far that penguin is from each of the three averages and picks the closest. Nobody tells it where the lines are. It finds them from the data, and if the data changes, so does the model.
📘 Revise: Stage 4 — Modelling
6Stage 5 — Evaluation
Both models were tested on the same 69 penguins that neither had seen. The rule based model got 64 of 69 correct. The learning based model got 66 of 69 correct, an accuracy of 95.7 %.
Accuracy alone can hide a weak spot, so precision and recall were worked out for each species from the confusion matrix. Gentoo scored 100% on both. Chinstrap had the lowest precision, 86.7%: of the 15 birds the model called Chinstrap, two were really Adelie. That matches what chart 1 warned about — Chinstrap is the smallest group, and the one it is easiest to confuse.
Which number matters most here? A wrong species is not dangerous to anyone, and both kinds of mistake cost the same — one bird counted in the wrong column. So accuracy is a fair way to judge this model. In a medical project that would not be true, and the diabetes screening project shows why.
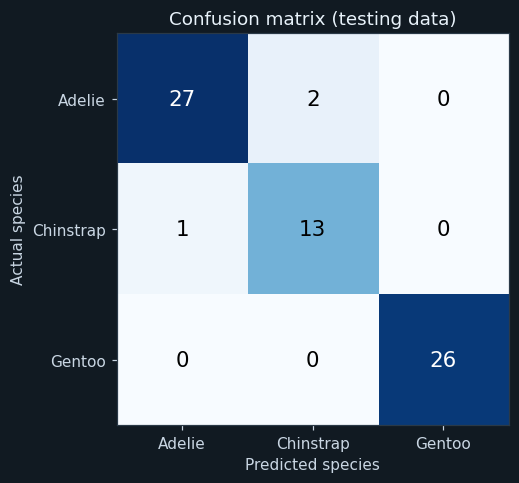
Rows are what the penguin really was. Columns are what the model said. The boxes on the diagonal, from top left to bottom right, are correct answers. Every number off the diagonal is a mistake, and its position says what kind of mistake.
Every Gentoo in the testing data was named correctly, and nothing else was called a Gentoo. All three mistakes are between Adelie and Chinstrap: two Adelie were called Chinstrap and one Chinstrap was called Adelie. That is exactly the overlap seen in chart 3.
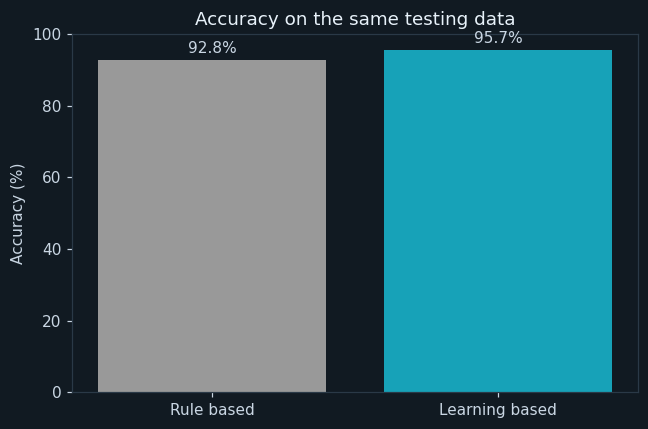
One bar for each model. The height is its accuracy on the same 69 testing penguins.
The rule based model scored 92.8 % and the learning based model scored 95.7 %. Both are good. The learning based model is better because it uses all four measurements together, while our two rules use only two.
There is a second difference that the bar chart cannot show. To change the rule based model, a person must study the charts again. The learning based model only needs new data, and it learns again by itself.
📘 Revise: The Confusion Matrix
7Stage 6 — Deployment
The last part of the program does what a volunteer at the colony would do: it takes the measurements of three penguins the model has never seen and names each one.
In real use this would be a simple form on a phone. The volunteer types four numbers, and the species appears. The expert's time is then spent only on the birds the model is unsure about — the ones close to the Adelie–Chinstrap line.
📘 Revise: Stage 6 — Deployment
8Ethical concerns
An AI project is not finished when the model works. The curriculum asks three questions of every model — is it fair (bias), can it explain itself (transparency), and who answers for its mistakes (accountability). For this project:
The measurements were collected by scientists, and they made the data free to use on the condition that it is credited. Using it without saying where it came from would break that agreement, and it would also break the CBSE rule that every resource must be referenced.
All the birds come from three islands and three summers. A Gentoo from a colony a thousand kilometres away might be a little bigger or smaller. The model has learned these colonies, not all penguins everywhere, and the report should say so.
Both models can explain themselves. The rules are two lines anyone can read, and the learning based model's averages are printed in the output. A scientist can check why a bird was given a species — which is not true of every AI model.
📘 Revise: Bias, Transparency, Accountability
9Source code
The whole program — it is also in the downloads at the top of this page — in Python with pandas, NumPy and matplotlib — the three libraries of Unit 7. It is laid out as the six stages of the AI Project Cycle, one after another. Every chart on this page was drawn by it, and every number came out of running it.
# ---------------------------------------------------------------------------
# penguin_species.py
#
# AI project on Statistical Data: predicting a penguin's species from four
# measurements of its body.
#
# CBSE Class X, Artificial Intelligence (417), Part C project work.
# SDG 14 (Life below Water) and SDG 15 (Life on Land).
#
# The program follows the six stages of the AI Project Cycle, in order:
#   1. Problem scoping      2. Data acquisition     3. Data exploration
#   4. Modelling            5. Evaluation           6. Deployment
#
# It builds two models and compares them:
#   - a RULE BASED model, whose rules we write ourselves after looking at the
#     charts, and
#   - a LEARNING BASED model, which works out the "typical" penguin of each
#     species from the training data on its own.
#
# Libraries: pandas (the data), numpy (the arithmetic), matplotlib (charts).
# ---------------------------------------------------------------------------

# %% Stage 1 - Problem scoping
print("=" * 60)
print("PENGUIN SPECIES PREDICTION")
print("=" * 60)
print("Who   : field scientists counting penguins in Antarctica")
print("What  : telling three similar species apart takes an expert")
print("Where : on the islands, during the breeding season")
print("Why   : species counts show how each one is coping with change")
print()

# %% Stage 2 - Data acquisition
import pandas as pd
import numpy as np
import matplotlib.pyplot as plt

# Show every column when a table is printed, instead of "..." in the middle.
pd.set_option("display.width", 120)
pd.set_option("display.max_columns", 20)

data = pd.read_csv("penguins.csv")

print("--- Stage 2: Data acquisition ---")
print("Rows read    :", len(data))
print("Columns read :", len(data.columns))
print()
print("The first 10 rows:")
print(data.head(10))
print()
data.info()
print()

# %% Stage 3 - Data exploration
print("--- Stage 3: Data exploration ---")

# The four measurements the model will use. These are the FEATURES; the
# species is the LABEL - the answer the model has to predict.
features = ["bill_length_mm", "bill_depth_mm", "flipper_length_mm", "body_mass_g"]
label = "species"

# A penguin with a measurement missing cannot be compared with anything, so
# that row is removed. The count is printed so nothing disappears silently.
missing = data[features].isnull().any(axis=1).sum()
data = data.dropna(subset=features)
print("Rows with a measurement missing :", missing, "(removed)")
print("Rows left                       :", len(data))
print()

print("Penguins of each species:")
counts = data[label].value_counts()
print(counts)
print()

# Mean, median and mode of one feature, worked out with numpy and pandas.
flipper = data["flipper_length_mm"]
print("Flipper length - mean   :", round(np.mean(flipper), 1), "mm")
print("Flipper length - median :", np.median(flipper), "mm")
print("Flipper length - mode   :", flipper.mode()[0], "mm")
print()

print("Average measurements of each species:")
print(data.groupby(label)[features].mean().round(1))
print()

colours = {"Adelie": "#f28e2b", "Chinstrap": "#9467bd", "Gentoo": "#17a2b8"}
species_list = ["Adelie", "Chinstrap", "Gentoo"]

# Chart 1: how many of each species - is the data balanced?
plt.figure(figsize=(6, 4))
plt.bar(species_list, counts.reindex(species_list, fill_value=0),
        color=[colours["Adelie"], colours["Chinstrap"], colours["Gentoo"]])
plt.title("Penguins of each species in the dataset")
plt.xlabel("Species")
plt.ylabel("Number of penguins")
plt.tight_layout()
plt.savefig("chart1_species_count.png")
plt.close()

# Chart 2: flipper length against body mass, one colour per species.
plt.figure(figsize=(7, 5))
for s in species_list:
    rows = data[data[label] == s]
    plt.scatter(rows["flipper_length_mm"], rows["body_mass_g"],
                color=colours[s], label=s, alpha=0.75)
plt.title("Flipper length and body mass")
plt.xlabel("Flipper length (mm)")
plt.ylabel("Body mass (g)")
plt.legend()
plt.grid(True, linestyle="--", alpha=0.4)
plt.tight_layout()
plt.savefig("chart2_flipper_mass.png")
plt.close()

# Chart 3: bill length against bill depth.
plt.figure(figsize=(7, 5))
for s in species_list:
    rows = data[data[label] == s]
    plt.scatter(rows["bill_length_mm"], rows["bill_depth_mm"],
                color=colours[s], label=s, alpha=0.75)
plt.title("Bill length and bill depth")
plt.xlabel("Bill length (mm)")
plt.ylabel("Bill depth (mm)")
plt.legend()
plt.grid(True, linestyle="--", alpha=0.4)
plt.tight_layout()
plt.savefig("chart3_bill.png")
plt.close()

# %% Stage 4 - Modelling
print("--- Stage 4: Modelling ---")

# Train-test split. The rows are shuffled (random_state fixes the shuffle so
# every run is the same), then 80% are used to TRAIN and 20% are kept aside
# to TEST. The model never sees the testing rows while it is being built.
data = data.sample(frac=1, random_state=7)
cut = int(len(data) * 0.8)
train = data[:cut]
test = data[cut:]
print("Training rows :", len(train))
print("Testing rows  :", len(test))
print()

# Model A - RULE BASED. These two rules were written by hand after looking
# at charts 2 and 3: Gentoo have the longest flippers, and of the other two,
# Chinstrap have the longer bill.
rule_predictions = []
for i in range(len(test)):
    row = test.iloc[i]
    if row["flipper_length_mm"] >= 206:
        rule_predictions.append("Gentoo")
    elif row["bill_length_mm"] >= 44:
        rule_predictions.append("Chinstrap")
    else:
        rule_predictions.append("Adelie")

# Model B - LEARNING BASED. The model learns the average penguin of each
# species from the training rows, then labels a new penguin with whichever
# average it is closest to.
#
# Body mass is in thousands and bill depth is under 25, so measured as they
# are, mass would drown out everything else. Each feature is first rescaled
# to run from 0 to 1, using the smallest and largest value in TRAINING data.
low = train[features].min()
high = train[features].max()
train_scaled = (train[features] - low) / (high - low)
test_scaled = (test[features] - low) / (high - low)

averages = train_scaled.groupby(train[label]).mean()
print("What the model learned - the average penguin of each species")
print("(every feature rescaled to run from 0 to 1):")
print(averages.round(2))
print()

learned_predictions = []
for i in range(len(test)):
    row = test_scaled.iloc[i]
    # Distance from this penguin to each species' average: the gaps are
    # squared and added up. The smallest total is the closest species.
    distance = ((averages - row) ** 2).sum(axis=1)
    learned_predictions.append(distance.idxmin())

# %% Stage 5 - Evaluation
print("--- Stage 5: Evaluation ---")
actual = list(test[label])

rule_correct = 0
learned_correct = 0
for i in range(len(actual)):
    if rule_predictions[i] == actual[i]:
        rule_correct = rule_correct + 1
    if learned_predictions[i] == actual[i]:
        learned_correct = learned_correct + 1

rule_accuracy = rule_correct / len(actual) * 100
learned_accuracy = learned_correct / len(actual) * 100
print("Rule based model     :", rule_correct, "of", len(actual), "correct")
print("Learning based model :", learned_correct, "of", len(actual), "correct")
print("Accuracy of the rule based model     :", round(rule_accuracy, 1), "%")
print("Accuracy of the learning based model :", round(learned_accuracy, 1), "%")
print()

# The confusion matrix: rows are what the penguin really was, columns are
# what the model said. Everything on the diagonal is a correct prediction.
matrix = pd.crosstab(pd.Series(actual, name="Actual"),
                     pd.Series(learned_predictions, name="Predicted"))
matrix = matrix.reindex(index=species_list, columns=species_list, fill_value=0)
print("Confusion matrix of the learning based model:")
print(matrix)
print()

# Precision and recall for each species, read straight off the matrix.
print("Species      Precision   Recall")
for s in species_list:
    tp = matrix.loc[s, s]
    predicted_as_s = matrix[s].sum()
    really_s = matrix.loc[s].sum()
    if predicted_as_s > 0:
        precision = tp / predicted_as_s * 100
    else:
        precision = 0
    if really_s > 0:
        recall = tp / really_s * 100
    else:
        recall = 0
    print(s.ljust(12), str(round(precision, 1)).rjust(8), "%", str(round(recall, 1)).rjust(7), "%")
print()

# Chart 4: the confusion matrix, drawn as a grid of coloured boxes.
plt.figure(figsize=(5.5, 4.5))
plt.imshow(matrix.values, cmap="Blues")
for r in range(len(species_list)):
    for c in range(len(species_list)):
        value = matrix.values[r][c]
        if value > matrix.values.max() / 2:
            ink = "white"
        else:
            ink = "black"
        plt.text(c, r, value, ha="center", va="center", fontsize=14, color=ink)
plt.xticks(range(3), species_list)
plt.yticks(range(3), species_list)
plt.xlabel("Predicted species")
plt.ylabel("Actual species")
plt.title("Confusion matrix (testing data)")
plt.tight_layout()
plt.savefig("chart4_confusion_matrix.png")
plt.close()

# Chart 5: the two models side by side.
plt.figure(figsize=(6, 4))
plt.bar(["Rule based", "Learning based"], [rule_accuracy, learned_accuracy],
        color=["#999999", "#17a2b8"])
plt.ylim(0, 100)
plt.title("Accuracy on the same testing data")
plt.ylabel("Accuracy (%)")
plt.text(0, rule_accuracy + 2, str(round(rule_accuracy, 1)) + "%", ha="center")
plt.text(1, learned_accuracy + 2, str(round(learned_accuracy, 1)) + "%", ha="center")
plt.tight_layout()
plt.savefig("chart5_models_compared.png")
plt.close()

# %% Stage 6 - Deployment
print("--- Stage 6: Deployment ---")
print("Three penguins measured on a new visit:")

new_penguins = pd.DataFrame({
    "bill_length_mm":    [39.0, 50.5, 47.0],
    "bill_depth_mm":     [18.5, 19.0, 14.8],
    "flipper_length_mm": [188, 198, 215],
    "body_mass_g":       [3600, 3800, 5200],
})
new_scaled = (new_penguins - low) / (high - low)

for i in range(len(new_penguins)):
    distance = ((averages - new_scaled.iloc[i]) ** 2).sum(axis=1)
    m = new_penguins.iloc[i]
    print("Bill", m["bill_length_mm"], "x", m["bill_depth_mm"], "mm, flipper",
          int(m["flipper_length_mm"]), "mm,", int(m["body_mass_g"]), "g  ->",
          distance.idxmin())
The library calls it is built from
| Call | Where | What it does |
|---|---|---|
pd.read_csv() | Stage 2 | Reads the CSV file into a table (a DataFrame) |
data.head(10) | Stage 2 | Shows the first 10 rows |
data.info() | Stage 2 | Shows each column, its type, and how many values are not missing |
dropna(subset=...) | Stage 3 | Removes the rows with a measurement missing |
value_counts() | Stage 3 | Counts the penguins of each species |
np.mean / np.median / mode() | Stage 3 | The mean, median and mode of a column |
groupby(...).mean() | Stage 3, 4 | The average of each column for each species |
plt.bar / plt.scatter | Stage 3 | Draws the bar chart and the scatter plots |
sample(frac=1, random_state=7) | Stage 4 | Shuffles the rows the same way every run |
data[:cut], data[cut:] | Stage 4 | Splits the rows into training and testing |
idxmin() | Stage 4 | Gives the name of the smallest value — the closest species |
pd.crosstab() | Stage 5 | Builds the confusion matrix from actual and predicted labels |
plt.imshow / plt.text | Stage 5 | Draws the confusion matrix as coloured boxes with numbers |
plt.savefig() | Stages 3, 5 | Saves each chart as a PNG file |
10Sample output
A real run, exactly as it appeared. Nothing below was typed by hand.
============================================================
PENGUIN SPECIES PREDICTION
============================================================
Who   : field scientists counting penguins in Antarctica
What  : telling three similar species apart takes an expert
Where : on the islands, during the breeding season
Why   : species counts show how each one is coping with change

--- Stage 2: Data acquisition ---
Rows read    : 344
Columns read : 8

The first 10 rows:
  species     island  bill_length_mm  bill_depth_mm  flipper_length_mm  body_mass_g     sex  year
0  Adelie  Torgersen            39.1           18.7              181.0       3750.0    male  2007
1  Adelie  Torgersen            39.5           17.4              186.0       3800.0  female  2007
2  Adelie  Torgersen            40.3           18.0              195.0       3250.0  female  2007
3  Adelie  Torgersen             NaN            NaN                NaN          NaN     NaN  2007
4  Adelie  Torgersen            36.7           19.3              193.0       3450.0  female  2007
5  Adelie  Torgersen            39.3           20.6              190.0       3650.0    male  2007
6  Adelie  Torgersen            38.9           17.8              181.0       3625.0  female  2007
7  Adelie  Torgersen            39.2           19.6              195.0       4675.0    male  2007
8  Adelie  Torgersen            34.1           18.1              193.0       3475.0     NaN  2007
9  Adelie  Torgersen            42.0           20.2              190.0       4250.0     NaN  2007

<class 'pandas.core.frame.DataFrame'>
RangeIndex: 344 entries, 0 to 343
Data columns (total 8 columns):
 #   Column             Non-Null Count  Dtype
---  ------             --------------  -----
 0   species            344 non-null    object
 1   island             344 non-null    object
 2   bill_length_mm     342 non-null    float64
 3   bill_depth_mm      342 non-null    float64
 4   flipper_length_mm  342 non-null    float64
 5   body_mass_g        342 non-null    float64
 6   sex                333 non-null    object
 7   year               344 non-null    int64
dtypes: float64(4), int64(1), object(3)
memory usage: 21.6+ KB

--- Stage 3: Data exploration ---
Rows with a measurement missing : 2 (removed)
Rows left                       : 342

Penguins of each species:
species
Adelie       151
Gentoo       123
Chinstrap     68
Name: count, dtype: int64

Flipper length - mean   : 200.9 mm
Flipper length - median : 197.0 mm
Flipper length - mode   : 190.0 mm

Average measurements of each species:
           bill_length_mm  bill_depth_mm  flipper_length_mm  body_mass_g
species
Adelie               38.8           18.3              190.0       3700.7
Chinstrap            48.8           18.4              195.8       3733.1
Gentoo               47.5           15.0              217.2       5076.0

--- Stage 4: Modelling ---
Training rows : 273
Testing rows  : 69

What the model learned - the average penguin of each species
(every feature rescaled to run from 0 to 1):
           bill_length_mm  bill_depth_mm  flipper_length_mm  body_mass_g
species
Adelie               0.24           0.62               0.31         0.24
Chinstrap            0.61           0.63               0.41         0.26
Gentoo               0.57           0.21               0.77         0.66

--- Stage 5: Evaluation ---
Rule based model     : 64 of 69 correct
Learning based model : 66 of 69 correct
Accuracy of the rule based model     : 92.8 %
Accuracy of the learning based model : 95.7 %

Confusion matrix of the learning based model:
Predicted  Adelie  Chinstrap  Gentoo
Actual
Adelie         27          2       0
Chinstrap       1         13       0
Gentoo          0          0      26

Species      Precision   Recall
Adelie           96.4 %    93.1 %
Chinstrap        86.7 %    92.9 %
Gentoo          100.0 %   100.0 %

--- Stage 6: Deployment ---
Three penguins measured on a new visit:
Bill 39.0 x 18.5 mm, flipper 188 mm, 3600 g  -> Adelie
Bill 50.5 x 19.0 mm, flipper 198 mm, 3800 g  -> Chinstrap
Bill 47.0 x 14.8 mm, flipper 215 mm, 5200 g -> Gentoo11The same project without code
The curriculum builds this exact project in Orange, without writing code. Each widget below does the same job as one part of the Python program. The tool is Orange Data Mining.
Load penguins.csv. Set species as the target — this is the label.
Look at the rows, the same as data.head() in Python.
Plot flipper length against body mass, coloured by species. This is chart 2.
Keep 80% of the rows for training. Its Remaining Data output is the 20% for testing.
The learning based model. Connect the training data to it.
Give it the model, the training data and the testing data, and choose Test on test data. It shows accuracy (CA), precision and recall.
Connect it to Test and Score to see the same kind of grid as chart 4.
Give it the model and a table of new penguins to name them — this is deployment.
📘 Revise: No-Code AI, and Orange
12Testing
Every case below was actually run, and the result is what came back. Each one gives the whole program a small input of its own.
| Test case | Expected | Actual | Result |
|---|---|---|---|
| The real dataset, 344 rows | Rows read : 344 | Rows read : 344 | Pass |
| Rows with no measurements are removed, not guessed | Rows with a measurement missing : 2 (removed) | Rows with a measurement missing : 2 (removed) | Pass |
| 80% of the rows go to training | Training rows : 273 | Training rows : 273 | Pass |
| ...and the other 20% are kept for testing | Testing rows : 69 | Testing rows : 69 | Pass |
| Three species that never overlap: the learning based model is never wrong | Accuracy of the learning based model : 100.0 % | Accuracy of the learning based model : 100.0 % | Pass |
| Only the flipper is missing: that one row is still removed | Rows with a measurement missing : 1 (removed) | Rows with a measurement missing : 1 (removed) | Pass |
| Boundary: a flipper of exactly 206 mm counts as Gentoo | Accuracy of the rule based model : 100.0 % | Accuracy of the rule based model : 100.0 % | Pass |
| Boundary: 205.9 mm is just under the rule, so the rule gets it wrong | Accuracy of the rule based model : 0.0 % | Accuracy of the rule based model : 0.0 % | Pass |
| Boundary: a bill of exactly 44 mm counts as Chinstrap | Accuracy of the rule based model : 100.0 % | Accuracy of the rule based model : 100.0 % | Pass |
| The data file is missing | FileNotFoundError: [Errno 2] No such file or directory: 'penguins.csv' | FileNotFoundError: [Errno 2] No such file or directory: 'penguins.csv' | Pass |
13Results, limits and what next
- Four body measurements are enough to name a penguin's species correctly 95.7 % of the time.
- Gentoo are easy: their long flippers and heavy bodies set them apart, and no Gentoo was ever named wrongly.
- Adelie and Chinstrap are the hard pair. They are the same size; only the bill separates them.
- Two hand-written rules already reach 92.8 %. Learning from all four measurements does better.
- Chinstrap, the smallest group in the data, is the species the model is least sure about.
What this model cannot do
- The data comes from three islands and three years only
- Only three species; a fourth kind of penguin would be forced into one of the three
- A bird must be measured by hand — the model does not look at photographs
- The model always gives an answer, even for a bird that does not look like any of the averages
What to add next
This is where you make the project your own. Take one of these, or an idea of yours:
- Add the island as a feature and see whether accuracy improves
- Make the model say "not sure" when a penguin is almost the same distance from two averages
- Turn it into a Computer Vision project that names the species from a photograph
- Collect a small dataset of your own — leaves, eggs, seeds — and build the same project on it
What you may have to learn on your own
- Train-test split: why the testing data must be kept away from the model while it learns
- Reading a confusion matrix, and working out precision and recall for one class from it
- Why features on different scales must be rescaled before they are compared
- Building the same workflow in Orange Data Mining, as the curriculum does
14Conclusion
The project answered the question it asked. Four measurements that anybody can take are enough to name a penguin's species, and the learning based model did it with an accuracy of 95.7 % on birds it had never seen.
The most useful lesson was how much the Data Exploration stage gave. Two scatter plots showed which measurements mattered before any model was built, and they also explained the model's mistakes afterwards: every error was in the place where Adelie and Chinstrap overlap.
The learning based model beat the rules we wrote by hand. But the rules were not wasted — they were a way to check that the computer's answer made sense.
15Questions for the viva
The project carries a viva voce of its own, worth 5 marks. These are the questions it is most likely to ask about this project. Try answering each one aloud before opening it.
▸Which domain of AI does this project belong to, and why?
Statistical Data, because the input is numbers in a table — four measurements of each penguin — not images or text.
▸What are the features and the label in your project?
The features are bill length, bill depth, flipper length and body mass. The label is the species.
▸Is this classification or regression?
Classification, because the output is one of three fixed groups, not a number.
▸Why did you split the data into training and testing sets?
To test the model fairly. If it is tested on the same penguins it learned from, it can score well just by remembering them. Testing data it has never seen shows how it will do on new birds.
▸What is the difference between your two models?
In the rule based model, I wrote the rules myself after looking at the charts. The learning based model found the pattern on its own from the training data.
▸What does the confusion matrix tell you that accuracy does not?
Which mistakes the model makes. Here every mistake was between Adelie and Chinstrap, and Gentoo was never confused.
▸Which SDG does your project relate to?
SDG 14, Life below Water, and SDG 13, Climate Action. Penguin numbers show how healthy the ocean is, and the region is warming fast.
16References
- Gorman, K. B., Williams, T. D. and Fraser, W. R. (2014). Ecological sexual dimorphism and environmental variability within a community of Antarctic penguins (genus Pygoscelis). PLoS ONE 9(3): e90081.
- Horst, A. M., Hill, A. P. and Gorman, K. B. (2020). palmerpenguins: Palmer Archipelago (Antarctica) penguin data. CC0 licence — https://allisonhorst.github.io/palmerpenguins/
- Palmer Station Antarctica LTER — https://pal.lternet.edu/
- Orange Data Mining — https://orangedatamining.com/
- CBSE, Artificial Intelligence (Subject Code 417), Class X curriculum, 2026-27 — Part C, Practical and Project Work
- CBSE, Artificial Intelligence Facilitator Handbook, Class X
- pandas — https://pandas.pydata.org/docs/; NumPy — https://numpy.org/doc/; Matplotlib — https://matplotlib.org/stable/
- LambdaLab — https://www.lambdalab.in