Districts with Similar Health Needs
An unsupervised learning capstone: K-means clustering finds groups of districts with similar health needs from eight survey indicators — with no labels to learn from — so that each group can get the programme it needs instead of one plan for all.
1Introduction
Surveys such as the National Family Health Survey (NFHS) report dozens of health indicators for every district: how many births happen in hospitals, how many children are fully immunised or stunted, how many women are anaemic, and more.
A state with dozens of districts and dozens of indicators cannot plan district by district and indicator by indicator — but a single plan for the whole state ignores how different districts are. Some need hospitals and immunisation drives; others already have those, but children are still undernourished.
This capstone groups districts that look alike across eight indicators, using K-means clustering. Nobody has labelled the districts, so this is unsupervised learning: the method must find the groups on its own, and the team must decide how many groups there are and what each one means.
Good Health and Well-being
Reduced Inequalities
SDG 3 asks for healthy lives for all at all ages — target 3.1 on safe births, 3.2 on child deaths, 3.8 on health coverage. SDG target 10.2 asks for the inclusion of all, irrespective of where they live. Within one state, some districts are far behind others. Finding which districts share the same needs lets the state aim the right programme at the right places, so that the districts furthest behind are not served by a plan made for the average.
2Step 1 — Business Understanding
What is the problem that you are trying to solve? The handbook uses the 5W1H Problem Canvas for this step.
- • Families in districts that are behind
- • The state health department
- • District health officers
- • One plan for all districts misses their different needs
- • Too many indicators to compare by eye
- • All the districts of one state
- • Each time a new survey round is published, when plans are made
- • Programmes and funds reach the districts that need them
- • Each programme fits the need it is meant for
- • Cluster districts on eight survey indicators
- • Describe each group by its weakest indicators, and plan for each group
Problem statement
Who would use it: The state health department and the National Health Mission's state and district teams, who plan programmes and share out funds.
Talking to the stakeholders
The handbook pairs the 5W1H canvas with Design Thinking, which begins by empathising with the people who have the problem. The questions asked, and what each answer changed:
| Question asked | What we learned, and what it changed |
|---|---|
| To a state health planner: how are programmes planned now? | Mostly state-wide, with extra attention to a list of the 'worst' districts. But 'worst' at what? That question led to clustering instead of ranking. |
| To the same planner: how many groups could you plan for? | Three to six. One plan per district is too many; two groups would be too crude. That set the range of k to try. |
| To a district health officer: which indicators matter most? | Births in hospitals, immunisation, child stunting and anaemia — and the things around them: sanitation, clean cooking fuel, women's literacy and health insurance. Those became the eight indicators. |
| To the officer: is the survey data clean? | Mostly, but numbers are typed in by hand — a missing decimal point is common. So values above 100 percent are checked. |
| To a public health teacher: why not simply rank the districts? | A rank gives one number. Two districts can have the same rank for different reasons — one lacks hospitals, the other has hospitals but hungry children. They need different programmes. |
| To the planner: what will you do with the groups? | Use each group's weak points to choose its programme — and check after the next survey whether districts have moved. That shaped deployment and feedback. |
How it is handled today
Simple to run, but treat a district with no hospital and one with hungry children in the same way.
Lists of the furthest-behind districts, such as the Aspirational Districts Programme's composite index, focus attention well — but a rank is one number, and hides why a district is behind.
Officers can study each district's factsheet, but no one can compare hundreds of numbers across dozens of districts by eye.
Objectives
- To frame district health planning with the 5W1H canvas and interviews
- To prepare eight district indicators for clustering: duplicates, typing errors, blanks and scaling
- To cluster districts with K-means, choosing the number of groups with the elbow method and the silhouette score
- To check that the groups are stable and describe each group by its weakest indicators
- To place a new district in a group, and use the next survey as feedback
3Step 2 — Analytic Approach
The question is not to predict anything but to describe the districts: which ones are alike, and how. That is descriptive analytics.
There are no labels — no one has said which group each district belongs to — so the model must be unsupervised learning, and the technique is clustering.
| Candidate | Why it was considered |
|---|---|
| K-means clustering | Places k centres, puts each district with its nearest centre, moves each centre to the middle of its districts, and repeats until nothing changes. |
| Elbow method | Plots how tightly packed the groups are (inertia) against k; the bend in the curve suggests a good k. |
| Silhouette score | For each district, compares how close it is to its own group with how close it is to the next group. The average, from −1 to 1, measures how clearly separated the groups are. |
4Step 3 — Data Requirements
The data needs one row per district and the same indicators for every district, from the same survey round, so that districts are compared fairly.
The indicators must describe needs that programmes can act on. Eight were chosen from the interviews: four health outcomes and services, and four conditions around them.
| Data needed | Type | Format | Source |
|---|---|---|---|
| Births in a health facility | Percent | of births in the last 5 years | NFHS district factsheet |
| Children fully immunised | Percent | of children aged 12–23 months | NFHS district factsheet |
| Children stunted | Percent | of children under 5 (lower is better) | NFHS district factsheet |
| Women anaemic | Percent | of women aged 15–49 (lower is better) | NFHS district factsheet |
| Improved sanitation, clean fuel | Percent | of households | NFHS district factsheet |
| Women literate, health insurance | Percent | of women / of households | NFHS district factsheet |
5Step 4 — Data Collection
In a real project, these indicators come from the NFHS district factsheets, which the Ministry of Health and Family Welfare and the International Institute for Population Sciences publish for every district. That is secondary data; the interviews with planners and officers are primary data.
The sample file, districts.csv, holds 301 rows for 300 imaginary districts, with 8 indicators each. districts_next_survey.csv holds the same districts in a later survey round, used for feedback. The data is a LambdaLab sample: realistic in range and pattern, but not real district figures.
| Column | Type | What it holds | Role |
|---|---|---|---|
district | text | District name | identifier, not used for clustering |
institutional_births_pct | decimal | Births in a hospital or health centre, % | feature |
full_immunisation_pct | decimal | Children fully immunised, %; some blank | feature |
stunted_children_pct | decimal | Children too short for their age, % (lower is better) | feature |
anaemic_women_pct | decimal | Women with anaemia, % (lower is better) | feature |
improved_sanitation_pct | decimal | Households with improved sanitation, % | feature |
clean_fuel_pct | decimal | Households cooking with clean fuel, %; some blank | feature |
women_literacy_pct | decimal | Women who can read and write, % | feature |
health_insurance_pct | decimal | Households with health insurance, %; some blank | feature |
districts.csv — Eight health indicators for each district. 301 rows, 15.7 KB. Download the file
districts_next_survey.csv — The same districts in the next survey, used only for feedback. 300 rows, 15.7 KB. Download the file
The first eight rows of districts.csv
| district | institutional_births_pct | full_immunisation_pct | stunted_children_pct | anaemic_women_pct | improved_sanitation_pct | clean_fuel_pct | women_literacy_pct | health_insurance_pct |
|---|---|---|---|---|---|---|---|---|
District 101 | 93.5 | 81.1 | 34.4 | 54.9 | 72.7 | 37.7 | 86.8 | 30.7 |
District 102 | 63.9 | 59.4 | 40.1 | 57.0 | 51.5 | 16.8 | 58.0 | 16.5 |
District 103 | 83.9 | 71.5 | 32.0 | 43.4 | 92.9 | 67.4 | 75.9 | 47.3 |
District 104 | 98.8 | 93.1 | 18.4 | 52.1 | 93.8 | 73.5 | 99.5 | 70.1 |
District 105 | 84.6 | 64.4 | 31.9 | 54.0 | 84.6 | 55.6 | 79.2 | 53.5 |
District 106 | 65.3 | 50.3 | 45.8 | 69.0 | 50.2 | 25.8 | 57.8 | 37.5 |
District 107 | 65.6 | 52.2 | 45.2 | 65.2 | 58.2 | | 58.5 | |
District 108 | 95.1 | 86.5 | 13.5 | 48.6 | 90.3 | 82.8 | 87.5 | 61.3 |
The first four rows of districts_next_survey.csv
| district | institutional_births_pct | full_immunisation_pct | stunted_children_pct | anaemic_women_pct | improved_sanitation_pct | clean_fuel_pct | women_literacy_pct | health_insurance_pct |
|---|---|---|---|---|---|---|---|---|
District 101 | 94.9 | 85.6 | 28.6 | 55.7 | 78.0 | 42.1 | 88.2 | 35.3 |
District 102 | 66.4 | 62.9 | 39.5 | 56.0 | 55.4 | 21.6 | 60.3 | 19.3 |
District 103 | 86.1 | 76.6 | 29.7 | 38.7 | 95.9 | 73.7 | 77.4 | 51.0 |
District 104 | 99.5 | 99.5 | 15.0 | 52.8 | 95.3 | 78.8 | 99.2 | 76.8 |
6Step 5 — Data Understanding
Is the data collected representative of the problem to be solved?
The first checks find blank cells in three indicators and values above 100 percent — impossible for a percentage, and a sign of a missing decimal point.
Chart 1 shows how the indicators move together. Five of them move strongly as a block: districts with more immunisation, clean cooking fuel and health insurance tend to have less stunting and anaemia (correlations of 0.5 to 0.8). Hospital births, sanitation and literacy move with them only weakly. So districts can be ahead on some things and behind on others — which is exactly why grouping them is more useful than ranking them.
Chart 2 shows that the indicators do not vary equally: clean cooking fuel varies the most across districts, stunting and anaemia the least. This matters for K-means, which measures distances.
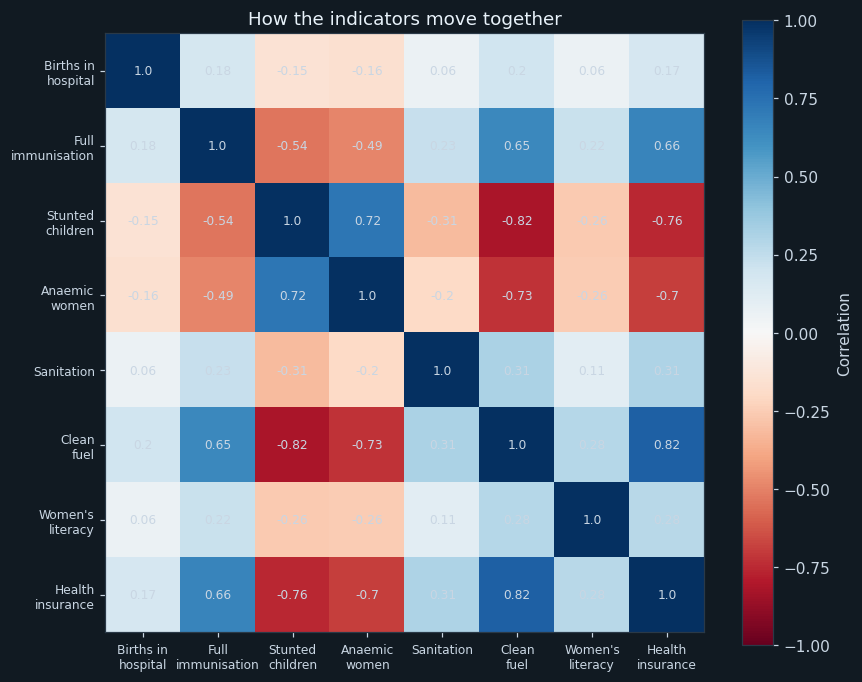
The correlation between every pair of indicators: blue for moving together, red for moving in opposite directions.
Immunisation, clean fuel and insurance move together (blue), and stunting and anaemia move against them (red) — a strong block. Hospital births, sanitation and literacy are only weakly linked to the rest, so a district can be ahead on those and behind on nutrition, or the reverse.
7Step 6 — Data Preparation
Removed by district name, so no district counts twice in its group.
Any value above 100 is divided by 10 — 912 becomes 91.2 — as the officer described.
Filled with that indicator's median across districts. K-means cannot work with blanks, and dropping the districts would leave them out of every group.
Every indicator is rescaled to mean 0 and standard deviation 1 with StandardScaler, so each counts equally in the distances.
Feature engineering
No new features are made: each district is described by its eight indicators. What matters is scaling. Without it, a 20-point difference in clean fuel and a 20-point difference in stunting would count the same, though 20 points is ordinary for clean fuel and huge for stunting. After scaling, differences are measured in standard deviations, which is fair to every indicator.
Two indicators are 'lower is better' (stunting and anaemia). K-means does not care about direction, but describing the groups does, so the program flips their sign when it judges whether a group is better or worse than the state average.
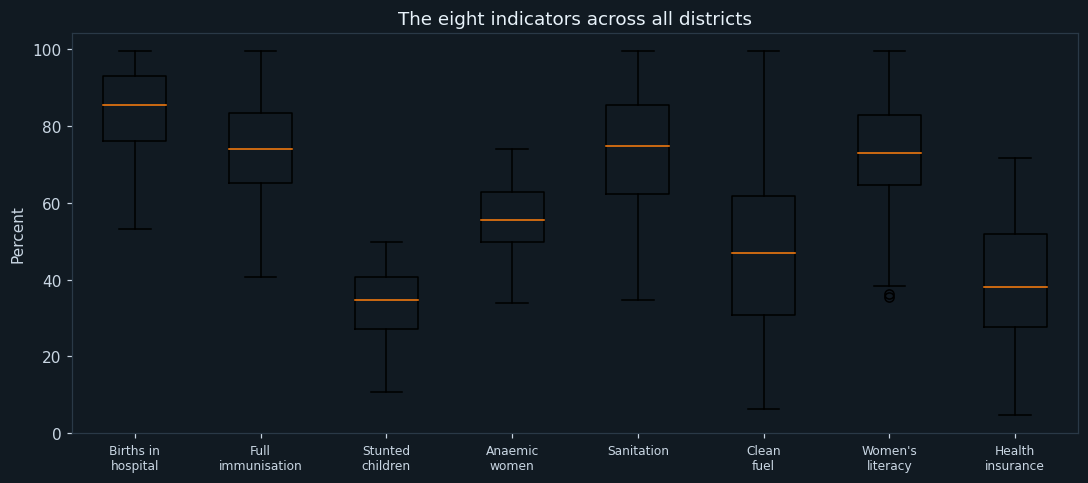
A box plot of each indicator across all districts.
Clean fuel spreads across almost the whole range; stunting and anaemia sit in narrow bands. Without scaling, clean fuel would dominate the distances K-means measures.
8Step 7 — Modelling
There are no labels to learn from, so the districts cannot be split into training and testing sets to check predictions. Instead, the model is judged by how clearly separated and how stable its groups are, and by whether the groups make sense to the people who will use them.
K-means needs k, the number of groups, decided in advance. The planner said three to six groups could be used; the program tries k from 2 to 8 and uses the elbow method and the silhouette score to choose.
How the models work
For each k, K-means is run with n_init=10: it starts from ten different random positions and keeps the best result, because a single start can end in a poor grouping. The silhouette was highest at 0.4115, for k = 3, with k = 4 almost equal; the elbow is at 4. When two values of k have almost the same silhouette, the program keeps the larger, because more groups mean more targeted programmes. Number of groups chosen: 4.
K-means numbers its clusters in no particular order, so the program renames them by need: each group's centre is averaged across the eight indicators (with stunting and anaemia flipped), and Group 1 is the group that is worst off.
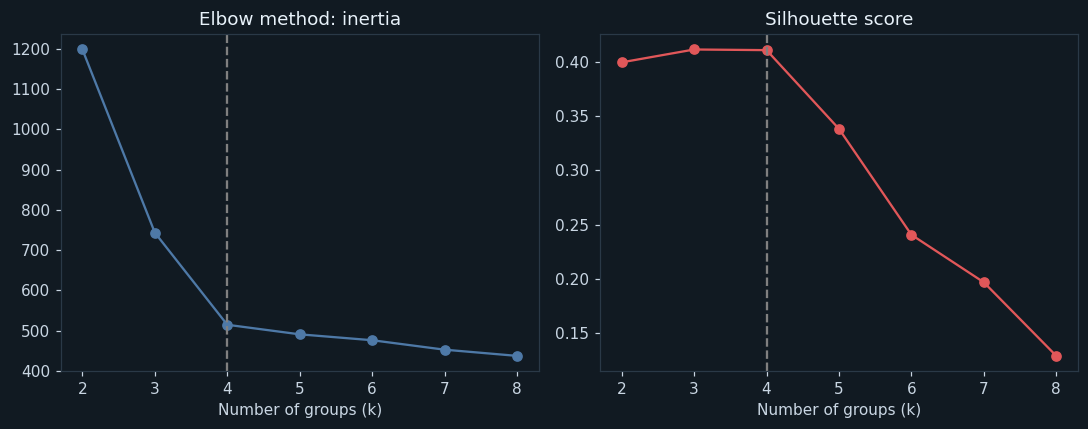
Left: inertia (how tightly packed the groups are) for k from 2 to 8. Right: the silhouette score for each k. The dashed line marks the k chosen.
Inertia falls steeply up to k = 4 and then flattens — the elbow is at 4. The silhouette is highest for 3 and 4, almost equally, and falls quickly after 4. Both point to four groups.
9Step 8 — Evaluation
The silhouette score of the four groups is 0.411, which means the groups are reasonably well separated, though not perfectly — real districts form a range, not islands. 0 districts had a negative silhouette, which would mean being closer to another group than to their own.
K-means depends on its starting point, so the clustering was repeated from ten other random starts. The agreement with the original grouping, measured by the adjusted Rand index (1 means identical), was at lowest 1.0. The groups are a property of the data, not of luck.
The groups have 70, 84, 86, 60 districts. The most important check is whether they mean something. Each group's weakest indicators compared with the state average are: Group 1 — births in hospital, full immunisation; Group 2 — stunted children, anaemic women; Group 3 — full immunisation; Group 4 — none - above average on all.
This is what a ranking would have hidden. Groups 2 and 3 are both in the middle of the state, but for opposite reasons: Group 2 has the hospitals and the vaccines but undernourished children and women; Group 3 has better nutrition and sanitation but lags on immunisation. They need different programmes.
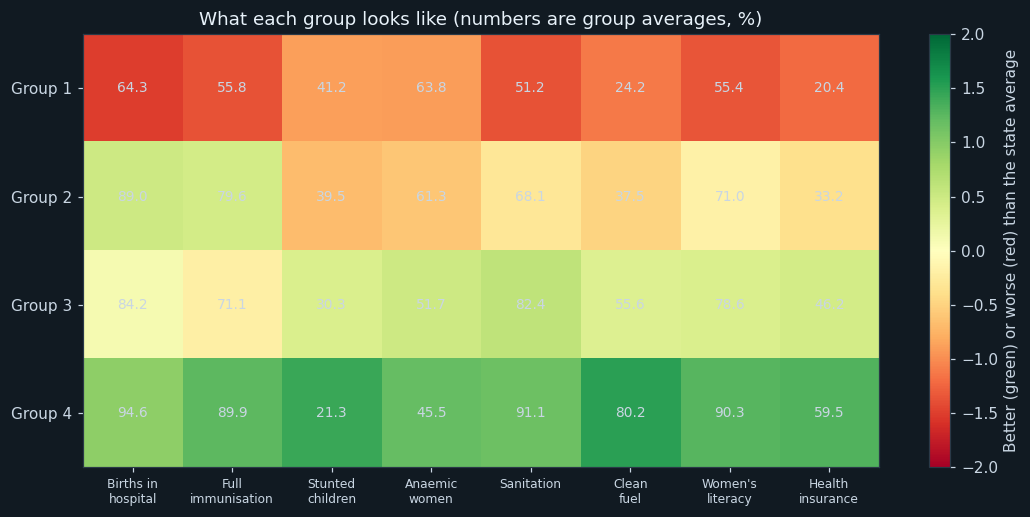
Each row is a group; each cell shows the group's average for an indicator, coloured green when better than the state average and red when worse.
Group 1 is red almost everywhere. Group 2 has good hospital births and immunisation but poor nutrition — stunting and anaemia are orange. Group 3 is the reverse: good nutrition and sanitation, weaker immunisation. Group 4 is green throughout.
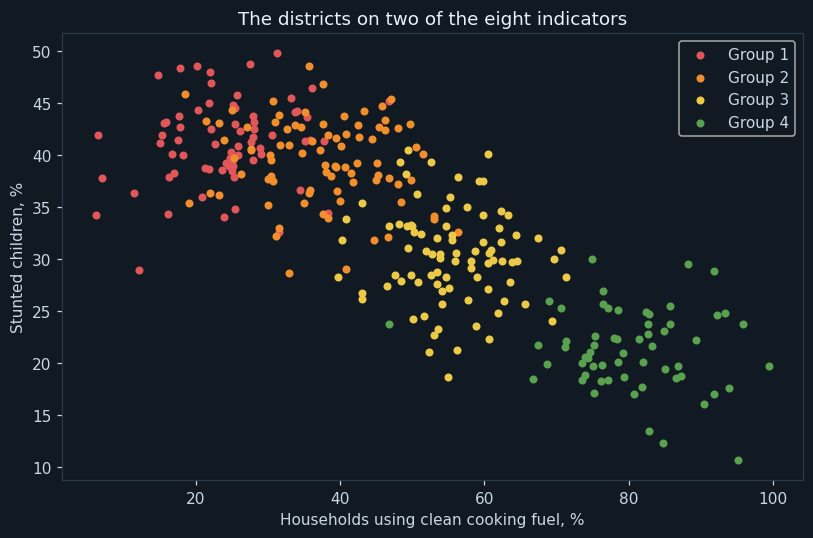
Each dot is a district, placed by clean fuel and stunting, coloured by its group.
Even on two of the eight indicators the groups are visible, from Group 1 at top left to Group 4 at bottom right. Groups 1 and 2 overlap here — both have many stunted children — and are told apart by other indicators, such as hospital births and immunisation.
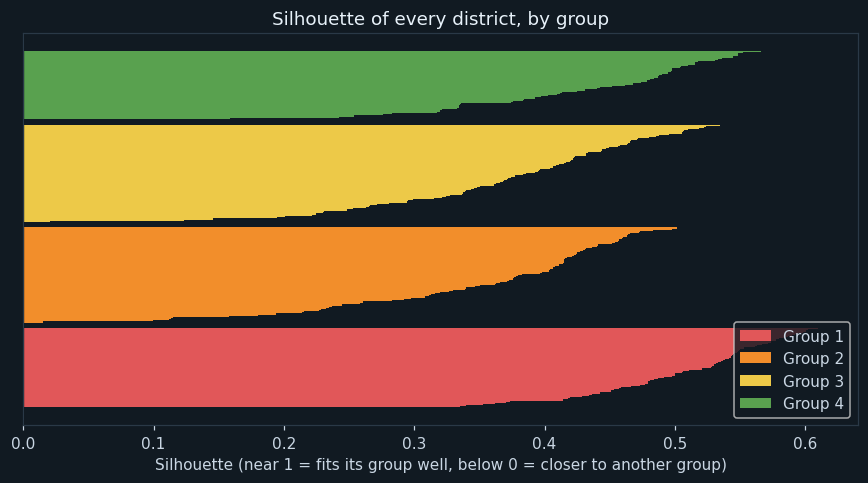
One bar per district, grouped and sorted: the longer the bar, the more clearly the district belongs to its group.
Every district has a positive silhouette — none is closer to another group than its own. Groups 1 and 4 are the most clear-cut; Groups 2 and 3 have more districts near their borders.
10Step 9 — Deployment
The medians, the scaler, the K-means model and the group names are saved together in district_groups.pkl. Any district can then be placed in a group by filling its blanks with the same medians, scaling it in the same way, and finding its nearest group centre.
The program tries a newly formed district whose health insurance figure is not yet known. It was placed in Group 2. Its programme focus follows from its group — stunted children, anaemic women.
In use, the state would get one page per group: its districts, its profile from chart 4, and the programmes matched to its weakest indicators — for example, immunisation drives and support for hospital births for Group 1, nutrition and anaemia programmes for Group 2.
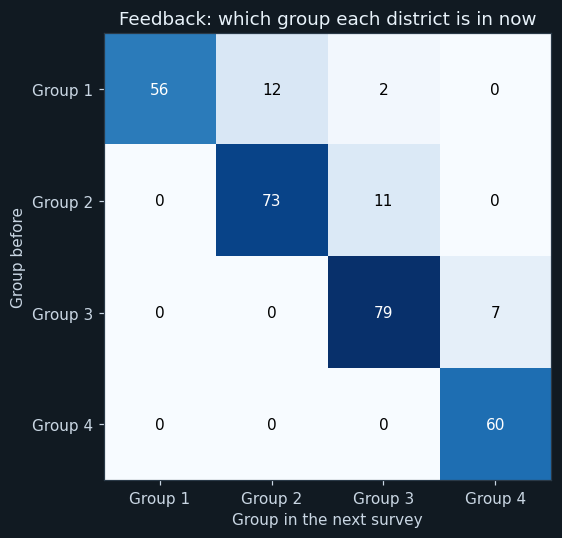
Rows are each district's group before, columns its group in the next survey, using the same group centres. The diagonal is districts that stayed.
Every move is towards a better-off group, and none backwards. Most districts stayed, but Group 1 shrank, and two districts jumped from Group 1 to Group 3.
11Step 10 — Feedback
When the next survey round arrived, each district was placed using the same group centres, so that a move between groups means real change. 32 districts changed group; 32 of them moved to a better-off group. Group 1 had 70 districts before and 56 after.
Two districts jumped two groups, from Group 1 to Group 3. These are the districts to learn from: what was done there, and could it work in the others still in Group 1?
Keeping the old centres measures progress. But as districts improve, the groups drift out of date; at some point the state should cluster afresh on the new survey, and the planner should check that the new groups still make sense.
12Ethical considerations
Calling a district 'Group 1' must never become a stigma for the people who live there. The groups describe needs in order to direct help, not to judge.
A district in Group 4 can still have villages, castes or tribes far behind. Clustering districts does not replace attention to the most excluded within each district.
Choosing which indicators to use is a human decision that shapes the groups. It should be made openly, with health experts, and explained.
Groups should guide which programmes go where — not reduce help to districts that are improving before the improvement is secure.
13Source code
The whole program, laid out as the ten steps of the methodology. Every chart and number on this page came out of running it.
# ---------------------------------------------------------------------------
# district_health.py
#
# Capstone project: grouping districts with similar health needs, so that
# each group gets the programme it needs instead of one plan for all.
#
# CBSE Class XII, Artificial Intelligence (843), Part C - Capstone Project.
# SDG 3 (Good Health and Well-being) and SDG 10 (Reduced Inequalities).
#
# Data Science Methodology, 10 steps. UNSUPERVISED LEARNING: the districts
# have no labels. K-means clustering finds the groups; the number of groups
# is chosen with the elbow method and the silhouette score, and the result
# is checked for stability. Each group is then described by its weakest
# indicators.
#
# Libraries: pandas, numpy, matplotlib, scikit-learn, joblib.
# ---------------------------------------------------------------------------

# %% Step 1 - Business Understanding
print("=" * 64)
print("DISTRICTS WITH SIMILAR HEALTH NEEDS")
print("=" * 64)
print("Problem : one state-wide plan treats every district the same,")
print("          though their health needs are very different")
print("Goal    : find groups of districts with similar needs, and what")
print("          each group needs most")
print()

# %% Step 2 - Analytic Approach
print("Analytic approach : descriptive - clustering (unsupervised learning)")
print("There are no labels: nobody has said which district belongs where")
print()

# %% Step 3 - Data Requirements
import pandas as pd
import numpy as np
import matplotlib.pyplot as plt
from sklearn.preprocessing import StandardScaler
from sklearn.cluster import KMeans
from sklearn.metrics import silhouette_score, silhouette_samples, adjusted_rand_score
import joblib

INDICATORS = ["institutional_births_pct", "full_immunisation_pct", "stunted_children_pct", "anaemic_women_pct",
              "improved_sanitation_pct", "clean_fuel_pct", "women_literacy_pct", "health_insurance_pct"]
SHORT = ["Births in\nhospital", "Full\nimmunisation", "Stunted\nchildren", "Anaemic\nwomen",
         "Sanitation", "Clean\nfuel", "Women's\nliteracy", "Health\ninsurance"]
LOWER_IS_BETTER = ["stunted_children_pct", "anaemic_women_pct"]

# %% Step 4 - Data Collection
data = pd.read_csv("districts.csv")
print("Districts collected :", len(data))
print("Indicators          :", len(INDICATORS))
print()

# %% Step 5 - Data Understanding
print("--- Step 5: Data Understanding ---")
print("Blank cells in each indicator:")
print(data[INDICATORS].isnull().sum().to_string())
print("Values above 100 percent :", int((data[INDICATORS] > 100).sum().sum()))
print()

# Chart 1: how the indicators move together.
corr = data[INDICATORS].corr()
plt.figure(figsize=(8, 6.5))
plt.imshow(corr, cmap="RdBu", vmin=-1, vmax=1)
for a in range(len(INDICATORS)):
    for b in range(len(INDICATORS)):
        plt.text(b, a, round(corr.iloc[a, b], 2), ha="center", va="center", fontsize=8)
plt.xticks(range(len(INDICATORS)), SHORT, fontsize=8)
plt.yticks(range(len(INDICATORS)), SHORT, fontsize=8)
plt.colorbar(label="Correlation")
plt.title("How the indicators move together")
plt.tight_layout()
plt.savefig("chart1_correlation.png")
plt.close()

# %% Step 6 - Data Preparation
print("--- Step 6: Data Preparation ---")
before = len(data)
data = data.drop_duplicates(subset="district").reset_index(drop=True)
print("District entered twice, removed :", before - len(data))
typo = data[INDICATORS] > 100
print("Values typed without the decimal point, fixed :", int(typo.sum().sum()))
for col in INDICATORS:
    data.loc[data[col] > 100, col] = data[col] / 10        # 912 -> 91.2
medians = data[INDICATORS].median()
print("Blank cells filled with the indicator's median :", int(data[INDICATORS].isnull().sum().sum()))
data[INDICATORS] = data[INDICATORS].fillna(medians)
print()
print("Spread (standard deviation) of each indicator:")
print(data[INDICATORS].std().round(1).to_string())
# K-means measures distance. Without scaling, the indicators that vary most
# (clean fuel, insurance) would decide the groups on their own.
scaler = StandardScaler()
X = scaler.fit_transform(data[INDICATORS])
print("Every indicator rescaled to mean 0 and standard deviation 1")
print()

# Chart 2: the spread of every indicator.
plt.figure(figsize=(10, 4.5))
plt.boxplot([data[c] for c in INDICATORS])
plt.xticks(range(1, len(INDICATORS) + 1), SHORT, fontsize=8)
plt.ylabel("Percent")
plt.title("The eight indicators across all districts")
plt.tight_layout()
plt.savefig("chart2_spread.png")
plt.close()

# %% Step 7 - Modelling
print("--- Step 7: Modelling ---")
print("k   inertia  silhouette")
inertias = []
silhouettes = []
ks = range(2, 9)
for k in ks:
    km = KMeans(n_clusters=k, n_init=10, random_state=0).fit(X)
    inertias.append(km.inertia_)
    silhouettes.append(silhouette_score(X, km.labels_))
    print(k, " ", round(km.inertia_, 1), "  ", round(silhouettes[-1], 4))
# When two values of k have almost the same silhouette, the larger one is
# kept: more groups mean more targeted programmes, at no cost in fit.
best = max(silhouettes)
K = max(k for k, s in zip(ks, silhouettes) if s >= best - 0.01)
print("Highest silhouette :", round(best, 4))
print("Number of groups chosen :", K)
print("(the most groups with a silhouette within 0.01 of the highest)")
model = KMeans(n_clusters=K, n_init=10, random_state=0).fit(X)
print()

# Chart 3: the elbow and the silhouette.
plt.figure(figsize=(10, 4))
plt.subplot(1, 2, 1)
plt.plot(list(ks), inertias, marker="o", color="#4e79a7")
plt.axvline(K, color="gray", linestyle="--")
plt.title("Elbow method: inertia")
plt.xlabel("Number of groups (k)")
plt.subplot(1, 2, 2)
plt.plot(list(ks), silhouettes, marker="o", color="#e15759")
plt.axvline(K, color="gray", linestyle="--")
plt.title("Silhouette score")
plt.xlabel("Number of groups (k)")
plt.tight_layout()
plt.savefig("chart3_elbow_silhouette.png")
plt.close()

# Name the groups in order of need: Group 1 has the greatest need.
sign = np.array([-1 if c in LOWER_IS_BETTER else 1 for c in INDICATORS])
wellbeing = (model.cluster_centers_ * sign).mean(axis=1)    # high = better off
order = np.argsort(wellbeing)
group_of = {old: new + 1 for new, old in enumerate(order)}
data["group"] = [group_of[g] for g in model.labels_]

# %% Step 8 - Evaluation
print("--- Step 8: Evaluation ---")
print("Silhouette score :", round(silhouette_score(X, model.labels_), 3))
same = []
for seed in range(1, 11):
    other = KMeans(n_clusters=K, n_init=10, random_state=seed).fit(X)
    same.append(adjusted_rand_score(model.labels_, other.labels_))
print("Lowest agreement with 10 runs from other starting points (adjusted Rand index) :", round(min(same), 3))
print("Districts in each group:")
print(data["group"].value_counts().sort_index().to_string())
print("Group sizes :", ", ".join(str(n) for n in data["group"].value_counts().sort_index()))
print()
profile = data.groupby("group")[INDICATORS].mean().round(1)
print("Average of each indicator in each group:")
print(profile.T.to_string())
print()
state = data[INDICATORS].mean()
need = {}
for g in profile.index:
    gap = (profile.loc[g] - state) / data[INDICATORS].std() * sign   # negative = worse than average
    weakest = gap.sort_values().index[:2]
    need[g] = [w for w in weakest if gap[w] < 0]
    names = [SHORT[INDICATORS.index(w)].replace("\n", " ").lower() for w in need[g]]
    print("Group", g, "- weakest compared with the state :", ", ".join(names) if names else "none - above average on all")
sil = silhouette_samples(X, model.labels_)
data["silhouette"] = sil
print("Districts that fit their group poorly (silhouette below 0) :", int((sil < 0).sum()))
print()

# Chart 4: each group's profile.
z = (profile - state) / data[INDICATORS].std() * sign
plt.figure(figsize=(10, 3.2 + 0.4 * K))
plt.imshow(z.values, cmap="RdYlGn", vmin=-2, vmax=2, aspect="auto")
for a in range(K):
    for b in range(len(INDICATORS)):
        plt.text(b, a, profile.iloc[a, b], ha="center", va="center", fontsize=9)
plt.xticks(range(len(INDICATORS)), SHORT, fontsize=8)
plt.yticks(range(K), ["Group " + str(g) for g in profile.index])
plt.colorbar(label="Better (green) or worse (red) than the state average")
plt.title("What each group looks like (numbers are group averages, %)")
plt.tight_layout()
plt.savefig("chart4_profiles.png")
plt.close()

# Chart 5: the groups on two of the indicators.
colours = ["#e15759", "#f28e2b", "#edc948", "#59a14f", "#4e79a7", "#b07aa1", "#9c755f", "#bab0ac"]
plt.figure(figsize=(7.5, 5))
for g in range(1, K + 1):
    part = data[data["group"] == g]
    plt.scatter(part["clean_fuel_pct"], part["stunted_children_pct"], s=18, color=colours[g - 1], label="Group " + str(g))
plt.xlabel("Households using clean cooking fuel, %")
plt.ylabel("Stunted children, %")
plt.title("The districts on two of the eight indicators")
plt.legend()
plt.tight_layout()
plt.savefig("chart5_scatter.png")
plt.close()

# Chart 6: how well each district fits its group.
plt.figure(figsize=(8, 4.5))
y0 = 0
for g in range(1, K + 1):
    s = np.sort(data.loc[data["group"] == g, "silhouette"].values)
    plt.barh(range(y0, y0 + len(s)), s, height=1.0, color=colours[g - 1], label="Group " + str(g))
    y0 = y0 + len(s) + 5
plt.axvline(0, color="black", linewidth=0.8)
plt.title("Silhouette of every district, by group")
plt.xlabel("Silhouette (near 1 = fits its group well, below 0 = closer to another group)")
plt.yticks([])
plt.legend(loc="lower right")
plt.tight_layout()
plt.savefig("chart6_silhouette.png")
plt.close()

# %% Step 9 - Deployment
print("--- Step 9: Deployment ---")
joblib.dump({"medians": medians, "scaler": scaler, "model": model, "group_of": group_of}, "district_groups.pkl")
saved = joblib.load("district_groups.pkl")


def group_for(values):
    row = pd.DataFrame([values], columns=INDICATORS).fillna(saved["medians"])
    label = saved["model"].predict(saved["scaler"].transform(row))[0]
    return saved["group_of"][label]


new_district = [78, 64, 36, 60, 64, 33, 66, None]
g = group_for(new_district)
print("A newly formed district, insurance figure not yet known : Group", g)
print("Programme focus for Group", g, ":", ", ".join(SHORT[INDICATORS.index(w)].replace("\n", " ").lower() for w in need[g]))
print()

# %% Step 10 - Feedback
print("--- Step 10: Feedback ---")
nxt = pd.read_csv("districts_next_survey.csv")
nxt["group"] = [group_for(list(r)) for r in nxt[INDICATORS].values]
both = data[["district", "group"]].merge(nxt[["district", "group"]], on="district", suffixes=("_before", "_after"))
moved = both[both["group_before"] != both["group_after"]]
print("Districts in the next survey        :", len(nxt))
print("Districts that changed group        :", len(moved))
print("  moved to a better-off group       :", int((moved["group_after"] > moved["group_before"]).sum()))
print("  moved to a group in greater need  :", int((moved["group_after"] < moved["group_before"]).sum()))
print("Districts in Group 1 before         :", int((both["group_before"] == 1).sum()))
print("Districts in Group 1 after          :", int((both["group_after"] == 1).sum()))
print("Districts that jumped two or more groups:")
jump = moved[moved["group_after"] - moved["group_before"] >= 2]
for _, r in jump.iterrows():
    print("  ", r["district"], ": Group", r["group_before"], "-> Group", r["group_after"])

# Chart 7: where each district went.
table = pd.crosstab(both["group_before"], both["group_after"]).reindex(index=range(1, K + 1), columns=range(1, K + 1), fill_value=0)
plt.figure(figsize=(6, 5))
plt.imshow(table.values, cmap="Blues")
for a in range(K):
    for b in range(K):
        plt.text(b, a, table.iloc[a, b], ha="center", va="center",
                 color="white" if table.iloc[a, b] > table.values.max() / 2 else "black")
plt.xticks(range(K), ["Group " + str(g) for g in range(1, K + 1)])
plt.yticks(range(K), ["Group " + str(g) for g in range(1, K + 1)])
plt.xlabel("Group in the next survey")
plt.ylabel("Group before")
plt.title("Feedback: which group each district is in now")
plt.tight_layout()
plt.savefig("chart7_next_survey.png")
plt.close()
The library calls it is built from
| Call | Step | What it does |
|---|---|---|
drop_duplicates(subset="district") | Step 6 | Removes the district entered twice |
data.loc[data[col] > 100, col] / 10 | Step 6 | Fixes a missing decimal point |
fillna(median()) | Step 6 | Fills blank cells |
StandardScaler().fit_transform() | Step 6 | Puts every indicator on the same scale |
KMeans(n_clusters=k, n_init=10) | Step 7 | The clustering, from ten starting points |
km.inertia_ | Step 7 | For the elbow method |
silhouette_score() / silhouette_samples() | Steps 7–8 | How clearly separated the groups are |
adjusted_rand_score() | Step 8 | Checks that the groups do not change between runs |
groupby("group").mean() | Step 8 | Each group's profile |
model.predict() | Steps 9–10 | Places a new or updated district in a group |
14Output of a real run
================================================================
DISTRICTS WITH SIMILAR HEALTH NEEDS
================================================================
Problem : one state-wide plan treats every district the same,
          though their health needs are very different
Goal    : find groups of districts with similar needs, and what
          each group needs most

Analytic approach : descriptive - clustering (unsupervised learning)
There are no labels: nobody has said which district belongs where

Districts collected : 301
Indicators          : 8

--- Step 5: Data Understanding ---
Blank cells in each indicator:
institutional_births_pct    0
full_immunisation_pct       4
stunted_children_pct        0
anaemic_women_pct           0
improved_sanitation_pct     0
clean_fuel_pct              4
women_literacy_pct          0
health_insurance_pct        5
Values above 100 percent : 3

--- Step 6: Data Preparation ---
District entered twice, removed : 1
Values typed without the decimal point, fixed : 3
Blank cells filled with the indicator's median : 12

Spread (standard deviation) of each indicator:
institutional_births_pct    12.4
full_immunisation_pct       13.1
stunted_children_pct         8.6
anaemic_women_pct            8.7
improved_sanitation_pct     15.9
clean_fuel_pct              21.3
women_literacy_pct          13.3
health_insurance_pct        15.6
Every indicator rescaled to mean 0 and standard deviation 1

--- Step 7: Modelling ---
k   inertia  silhouette
2   1197.7    0.3996
3   743.4    0.4115
4   514.9    0.4109
5   491.2    0.3383
6   476.6    0.2407
7   453.1    0.1968
8   437.8    0.1291
Highest silhouette : 0.4115
Number of groups chosen : 4
(the most groups with a silhouette within 0.01 of the highest)

--- Step 8: Evaluation ---
Silhouette score : 0.411
Lowest agreement with 10 runs from other starting points (adjusted Rand index) : 1.0
Districts in each group:
group
1    70
2    84
3    86
4    60
Group sizes : 70, 84, 86, 60

Average of each indicator in each group:
group                        1     2     3     4
institutional_births_pct  64.3  89.0  84.2  94.6
full_immunisation_pct     55.8  79.6  71.1  89.9
stunted_children_pct      41.2  39.5  30.3  21.3
anaemic_women_pct         63.8  61.3  51.7  45.5
improved_sanitation_pct   51.2  68.1  82.4  91.1
clean_fuel_pct            24.2  37.5  55.6  80.2
women_literacy_pct        55.4  71.0  78.6  90.3
health_insurance_pct      20.4  33.2  46.2  59.5

Group 1 - weakest compared with the state : births in hospital, full immunisation
Group 2 - weakest compared with the state : stunted children, anaemic women
Group 3 - weakest compared with the state : full immunisation
Group 4 - weakest compared with the state : none - above average on all
Districts that fit their group poorly (silhouette below 0) : 0

--- Step 9: Deployment ---
A newly formed district, insurance figure not yet known : Group 2
Programme focus for Group 2 : stunted children, anaemic women

--- Step 10: Feedback ---
Districts in the next survey        : 300
Districts that changed group        : 32
  moved to a better-off group       : 32
  moved to a group in greater need  : 0
Districts in Group 1 before         : 70
Districts in Group 1 after          : 56
Districts that jumped two or more groups:
   District 118 : Group 1 -> Group 3
District 392 : Group 1 -> Group 315The same project in Orange
Orange has K-means with a built-in silhouette table, which suits this project well. The tool is Orange Data Mining.
| Widget | What it does |
|---|---|
| File | Load districts.csv; mark district as a meta attribute (not a feature). |
| Impute | Fill blanks with the median (after fixing the values above 100 in a spreadsheet). |
| Preprocess | Normalise features to mean 0 and standard deviation 1. |
| k-Means | Try k from 2 to 8; Orange shows the silhouette score for each and selects the best. |
| Silhouette Plot | See how well each district fits its cluster. |
| Box Plot / Data Table | Group by cluster to describe each group's profile. |
16Testing
Every case was run: each gives the whole program a small input of its own.
| Test case | Expected | Actual | Result |
|---|---|---|---|
| Every district read | Districts collected : 301 | Districts collected : 301 | Pass |
| The district entered twice is removed | District entered twice, removed : 1 | District entered twice, removed : 1 | Pass |
| Percentages typed without the decimal point are fixed | Values typed without the decimal point, fixed : 3 | Values typed without the decimal point, fixed : 3 | Pass |
| Four groups: the most with a silhouette within 0.01 of the best | Number of groups chosen : 4 | Number of groups chosen : 4 | Pass |
| The groups do not depend on K-means' starting point | Lowest agreement with 10 runs from other starting points (adjusted Rand index) : 1.0 | Lowest agreement with 10 runs from other starting points (adjusted Rand index) : 1.0 | Pass |
| A new district with a missing figure is still placed in a group | A newly formed district, insurance figure not yet known : Group 2 | A newly formed district, insurance figure not yet known : Group 2 | Pass |
| Three clearly separate groups: three are found | Number of groups chosen : 3 | Number of groups chosen : 3 | Pass |
| Same figures in the next survey: no district changes group | Districts that changed group : 0 | Districts that changed group : 0 | Pass |
| One value typed as 600-something is fixed | Values typed without the decimal point, fixed : 1 | Values typed without the decimal point, fixed : 1 | Pass |
| The data file is missing | FileNotFoundError: [Errno 2] No such file or directory: 'districts.csv' | FileNotFoundError: [Errno 2] No such file or directory: 'districts.csv' | Pass |
17Team roles and timeline
A capstone is done by a group of 3 to 5. A suggested split of the work, and a timeline across the year:
| Role | Responsible for |
|---|---|
| Project lead | Business understanding; interviews with planners and officers |
| Data lead | The survey indicators; checking and cleaning them |
| Analyst | Correlations, spreads and scaling |
| Modeller | K-means, the elbow, the silhouette and the stability check |
| Documentation and video | Group profiles, the next-survey feedback, the report and the video |
| When | Methodology steps | Deliverable |
|---|---|---|
| June – July | 1 Business Understanding, 2 Analytic Approach | Problem statement; interviews |
| August | 3 Data Requirements, 4 Data Collection | Indicators chosen; district data collected |
| September | 5 Data Understanding, 6 Data Preparation | Errors fixed; indicators scaled |
| October | 7 Modelling, 8 Evaluation | k chosen; groups checked and described |
| November | 9 Deployment, 10 Feedback | Group pages; next survey compared |
| December – January | Documentation and video | Report and 3-minute video |
18Results, limits and what next
- The districts form 4 groups: the elbow and the silhouette agree.
- The groups are stable: the lowest agreement across ten restarts was 1.0.
- Two middle groups are behind for opposite reasons — nutrition in one, immunisation in the other — which a ranking would hide.
- Group 1 is behind on almost everything, worst on births in hospital, full immunisation.
- In the next survey, 32 districts moved to a better-off group and none moved back.
Limitations
- Sample data for imaginary districts
- Eight indicators only; others would change the groups
- K-means assumes round, similar-sized groups
- District averages hide inequality within districts
Future scope
- Use real NFHS district data for one state
- Add more indicators, chosen with health experts
- Cluster blocks within districts, where data allows
- Compare K-means with hierarchical clustering
What the team had to learn
- Unsupervised learning and clustering
- K-means, the elbow method and the silhouette score
- Why scaling matters for distance-based methods
- Checking stability with the adjusted Rand index
- Turning clusters into a description people can act on
19Conclusion
The capstone found four groups of districts with different health needs, with no labels to learn from. The number of groups was not guessed but chosen with the elbow method and the silhouette score, and the groups came out the same from every starting point.
Clustering's value was in what the groups meant. Two groups in the middle of the state turned out to be behind for opposite reasons, and need different programmes — something a single ranking would have hidden.
The next survey showed districts moving to better-off groups, and two districts jumping ahead. Clustering does not improve health by itself; it helps the state put the right programme in the right place, and see where it is working.
20The 3-minute video script
Part C asks for a video of exactly three minutes with six parts. A script, timed to the second:
| Time | Part | What to say and show |
|---|---|---|
| 0:00 – 0:25 | a. Problem statement | Show a map of districts. "One plan for the whole state treats every district the same — but their needs are not the same." |
| 0:25 – 0:40 | b. SDG alignment | SDG 3 and SDG 10 icons. "Health for all, and no district left behind." |
| 0:40 – 1:15 | c. AI concepts and algorithms | "Unsupervised learning: K-means clustering, with the elbow method and the silhouette score to choose the number of groups." |
| 1:15 – 2:15 | d. How it works | Chart 3: four groups chosen. Chart 4: what each group needs. Then a new district placed in its group, and the next survey's moves. |
| 2:15 – 2:45 | e. Conclusion | "Four groups, four kinds of need — and a way to see which districts are moving ahead." |
| 2:45 – 3:00 | f. Acknowledgement | "We thank our AI teacher, [name], and the health officers who guided us." |
21Questions for the viva
▸Why is this unsupervised learning?
The districts have no labels — no one has said which group each belongs to. The model finds the groups itself.
▸How does K-means work?
It places k centres, assigns each district to the nearest centre, moves each centre to the average of its districts, and repeats until the groups stop changing.
▸How did you choose k?
With the elbow method (where inertia stops falling steeply) and the silhouette score (how clearly the groups are separated). Both pointed to four.
▸Why did you scale the data?
K-means measures distances. Without scaling, indicators that vary a lot, like clean fuel, would decide the groups on their own.
▸What does a silhouette score of about 0.41 mean?
The groups are reasonably well separated but not perfectly — districts form a range rather than separate islands.
▸Why did you run K-means from ten other starting points?
K-means can give different groups from different starts. All ten agreed with the original, so the groups are stable.
▸Why not just rank the districts?
A rank is one number. Two districts can be equally behind for different reasons and need different programmes.
▸Which SDGs does it align to?
SDG 3, Good Health and Well-being, and SDG 10, Reduced Inequalities.
22References
- National Family Health Survey (NFHS-5) district factsheets, MoHFW and IIPS — https://rchiips.org/nfhs/
- National Health Mission — https://nhm.gov.in/
- NITI Aayog, Aspirational Districts Programme — https://www.niti.gov.in/
- scikit-learn: Clustering (K-means, silhouette) — https://scikit-learn.org/stable/modules/clustering.html
- CBSE, Artificial Intelligence (Subject Code 843), Class XII curriculum, 2026-27 — Part C
- CBSE, Artificial Intelligence Student Handbook, Class XII — Unit 2, Data Science Methodology
- Rollins, J. B. (2015). Foundational Methodology for Data Science. IBM Analytics.
- scikit-learn — https://scikit-learn.org/stable/; pandas, NumPy and Matplotlib documentation
- LambdaLab — https://www.lambdalab.in