A Month at the Kirana Shop
One month of counter sales, and the five things the shopkeeper could never work out from the day book.
1Introduction: the problem it solves
Every kirana shop keeps a day book. A sale is written down, the page is turned, and that is the end of it. Ask the shopkeeper which item earns the most and the answer comes back as a guess. Ask which day of the week is worth staffing properly and the answer is a shrug.
The information is not missing. It is sitting in the day book, in the wrong shape. Nobody is going to add up thirty pages by hand to find out that Sunday is worth twice a Tuesday, so nobody ever finds out.
This project takes one month of that day book, typed into a file the shop can manage, and turns it into five answers and five charts.
The owner of a neighbourhood kirana shop, and anybody who has to decide what to stock, when to open and what to keep on the front shelf.
Why it is worth doing on a computer
The work a computer is being asked to do here is not difficult. It is adding up, sorting and comparing — the same three things, over and over, on seven hundred lines. A person can do all three. What a person cannot do is do them again next month without losing an evening, and that is the whole reason this is worth computerising.
The cost of not doing it is invisible, which is why it goes on for years. Shelf space goes to an item that does not sell. The shop is short-staffed on the one day it is busy. A category that earns two thirds of the money gets the same attention as one that earns a fifteenth. None of those mistakes announces itself, and all of them show up in one afternoon's analysis.
Objectives
- To read a month of counter sales out of a plain CSV file that the shop can type in any spreadsheet
- To clean the file the way real data has to be cleaned — duplicate lines, blank prices, and the same category spelt three ways
- To find how sales move day by day across the month, and which day of the week is really the busiest
- To find which categories and which individual items the shop actually earns its money from
- To describe a typical bill, so the shopkeeper knows whether this is a shop of small bills or big ones
- To draw each of those answers as a chart, because a shopkeeper will look at a chart and will not look at a table
2How the job is done today
Before writing anything it is worth asking how the work is handled at present, and where each of those answers falls short. These were examined:
What almost every small shop actually uses. It records everything and answers nothing: finding out what sold best would mean reading and adding up every page, so nobody does it.
Some shops have one, and it does print reports. They are priced and shaped for a supermarket, the reports it gives are the ones its makers chose, and the data is locked inside it.
A genuine step up, and the closest thing to this project. It falls over when the categories change or a formula is dragged one row short, it will not clean the data, and rebuilding the charts every month is manual work again.
Worth doing, and the way this project started — but memory is not data. The shopkeeper here was sure that snacks were a big earner. They are 9.5 per cent.
3Where the data came from
CBSE asks that any resource used in a project be suitably referenced, and for a data project that rule is not a formality — a figure with no source attached to it does not mean anything. This section is the one an examiner will ask about.
The shop keeps a day book at the counter: date, bill number, item, quantity and price, one line per item sold. For this project one month of it was copied into a spreadsheet and saved as sales.csv. The category column is the only thing added — the shopkeeper was asked which of five groups each item belongs to.
The dataset shipped with this project is a LambdaLab sample of 703 lines built to look exactly like that day book, including its mistakes. It is here so the program can be run and marked before you have collected anything. It is not real trade, and it must not be presented as though it were.
For your own submission, go to a shop, ask, and copy a real month. Say in your report which shop it was, that the owner gave permission, and that no customer's name appears anywhere in the file — which it should not, because the bill number identifies the sale perfectly well without one.
4The dataset
One file in, two files out. sales.csv is what the shop types — one row per item on a bill, which is the shape the day book is already in, so nothing has to be rearranged before it can be entered. category_summary.csv and the five charts are what comes back.
sales.csv — one row for every item on every bill
| Field | Type | What it holds |
|---|---|---|
date | date (YYYY-MM-DD) | The day of the sale. Written this way round so it sorts correctly. |
bill_no | text | Which bill this line belongs to. Three items on one bill share a bill number. |
item | text | Name of the item, as the shop calls it. |
category | text | Grocery, Dairy, Snacks, Household or Personal Care. |
qty | integer | How many units were sold on this line. |
price | decimal | Price of one unit. Left blank when the shopkeeper did not fill it in. |
The first few lines of sales.csv
| date | bill_no | item | category | qty | price |
|---|---|---|---|---|---|
2026-06-01 | B1001 | Biscuits pack | Snacks | 1 | 30.00 |
2026-06-01 | B1001 | Namkeen 200g | Snacks | 1 | 55.00 |
2026-06-01 | B1001 | Butter 100g | Dairy | 1 | 58.00 |
2026-06-01 | B1002 | Milk 500ml | Dairy | 1 | 28.00 |
2026-06-01 | B1003 | Biscuits pack | Snacks | 1 | 30.00 |
2026-06-01 | B1004 | Sugar 1kg | Grocery | 1 | 46.00 |
2026-06-01 | B1005 | Biscuits pack | Snacks | 2 | 30.00 |
2026-06-01 | B1006 | Shampoo sachet | Personal Care | 3 | 3.00 |
Inside sales.csv
One month of the shop's day book, one row per item on a bill. It arrives with the mistakes real data arrives with, and the program is written to survive them. The whole file is 703 rows, 31.6 KB — too much to print here, so this is the head of it. The complete file comes with the download, and you can also take it on its own.
date,bill_no,item,category,qty,price
2026-06-01,B1001,Biscuits pack,Snacks,1,30.00
2026-06-01,B1001,Namkeen 200g,Snacks,1,55.00
2026-06-01,B1001,Butter 100g,Dairy,1,58.00
2026-06-01,B1002,Milk 500ml,Dairy,1,28.00
2026-06-01,B1003,Biscuits pack,Snacks,1,30.00
2026-06-01,B1004,Sugar 1kg,Grocery,1,46.00
2026-06-01,B1005,Biscuits pack,Snacks,2,30.00
2026-06-01,B1006,Shampoo sachet,Personal Care,3,3.005Cleaning the data
Real data arrives with mistakes in it, and this dataset has the ones real data actually has. What was wrong, how much of it there was, and what the program does about each — because how a problem is handled changes the answer, and a report has to say which choice it made.
drop_duplicates() removes a row that is identical to one already read. The program never puts two lines of the same item on one bill, so an exact repeat can only be a keying mistake.
dropna(subset=["price"]) drops them, and the count is printed. A blank price cannot be turned into money, and filling it with zero would quietly reduce the month's takings.
str.strip().str.title() makes them one category. Left alone, the shop's snacks would have been reported as three separate categories, each looking small.
Everything read from a file is text. read_csv converts the numeric columns for us here, and the report says so — but check it with dtypes, because one stray letter in a column turns the whole column back into text.
6What the program does
- Reads a month of counter sales from a CSV file the shopkeeper can edit in any spreadsheet
- Cleans the file: removes repeated lines, drops rows with no price, and makes one category out of three spellings
- Works out what each line of a bill was worth, and what the month came to
- Finds the busiest days of the month and the busiest day of the week, allowing for how many of each day the month held
- Ranks every category and every item by what it earned, and names the five slowest movers
- Describes a typical bill with count, mean, median and quartiles
- Draws five charts — a line, three bars and a histogram — and saves them as image files
- Writes a category summary back out as a CSV the shopkeeper can open
The pandas and pyplot it is built from
| Call | Where | What it is for |
|---|---|---|
pd.read_csv(..., parse_dates=) | step 1 | Loads the file and turns the date column into real dates rather than text |
df.drop_duplicates() | step 2 | Removes a row identical to one already read |
Series.str.strip().str.title() | step 2 | Makes " snacks " and "SNACKS" into one category |
df.dropna(subset=[...]) | step 2 | Drops only the rows missing the column that matters |
df["a"] * df["b"] | step 3 | Multiplies two whole columns at once — no loop needed |
df.groupby(col)[val].sum() | steps 4–8 | Collects rows that share a value and adds up another column |
Series.sort_values() / .head() | step 4 | Ranks the result and keeps the top of it |
Series.nunique() | step 3 | Counts how many different bills there were |
Series.describe() | step 7 | Count, mean, standard deviation, minimum, quartiles and maximum in one call |
Series.dt.day_name() | step 8 | Reads the weekday out of a real date |
Series.reindex(order) | step 8 | Puts Monday..Sunday in that order instead of alphabetically |
Series.idxmax() / idxmin() | step 8 | The label of the biggest and smallest value, not the value itself |
plt.plot / bar / barh / hist | steps 4–8 | The four kinds of chart this project uses |
plt.savefig() and plt.close() | steps 4–8 | Writes the chart to a file and clears the figure for the next one |
DataFrame.to_csv() | step 9 | Writes the summary back out for the shopkeeper |
7Technical details
| Language | Python 3 |
| Where the data lives | A plain CSV file, read into pandas |
| Libraries |
|
8How it works, step by step
read_csv() loads sales.csv, with parse_dates turning the date column into real dates. Without that, 2026-06-10 would sort before 2026-06-2.
Repeated rows are dropped, the category column is stripped and title-cased, and rows with no price are removed. Every count is printed, so nothing disappears silently.
One new column: amount = qty x price. Every figure in the report is built from it.
groupby() collects the rows by date, by category, by item, by bill and by weekday, and sums or describes each group.
Each answer is drawn with pyplot, saved as a PNG with savefig(), and the figure closed so the next chart starts clean.
9Source code
The whole program. Every chart further down this page was drawn by this listing, and every figure quoted came out of running it.
# ---------------------------------------------------------------------------
# sales_analysis.py
#
# Reads one month of counter sales from sales.csv, cleans the entries the shop
# typed by hand, and answers the four questions the shopkeeper actually asked:
#
#   1. Which days of the month are busy, and which are dead?
#   2. Which part of the shop earns the money?
#   3. Which items are worth keeping in stock, and which are not?
#   4. Is this a shop of small bills or big ones?
#   5. Which day of the week should the shop be fully stocked for?
#
# Each answer is printed as a table and drawn as a chart.
# ---------------------------------------------------------------------------

import pandas as pd
import matplotlib.pyplot as plt

# --- 1. Read -------------------------------------------------------------
# parse_dates turns the date column from text into real dates. Without it the
# month-wise sorting later would be alphabetical, so 2026-06-10 would come
# before 2026-06-2.
df = pd.read_csv("sales.csv", parse_dates=["date"])

print("Rows read from the file :", len(df))
print("Columns                 :", list(df.columns))
print()

# --- 2. Clean ------------------------------------------------------------
# The shop types this file itself, so it arrives with the mistakes anybody
# makes: the same line entered twice, a price column left empty, and the
# category spelt three different ways.

before = len(df)
df = df.drop_duplicates()                     # the same bill line keyed in twice
print("Duplicate rows removed  :", before - len(df))

# str.strip() removes the stray spaces, str.title() makes "snacks",
# "SNACKS" and " Snacks " into one category.
df["category"] = df["category"].str.strip().str.title()

# A row with no price cannot be turned into money, so it is dropped rather
# than guessed at. How many were dropped is printed, because a silent drop
# hides a problem with the shop's record-keeping.
missing = df["price"].isnull().sum()
df = df.dropna(subset=["price"])
print("Rows with no price      :", missing, "(dropped)")
print("Rows left for analysis  :", len(df))
print()

# --- 3. Derive -----------------------------------------------------------
# What each line of a bill was actually worth. Every figure below is built
# from this one column.
df["amount"] = df["qty"] * df["price"]

print("Total sales for the month : Rs", round(df["amount"].sum(), 2))
print("Number of bills           :", df["bill_no"].nunique())
print("Average value of a bill   : Rs", round(df.groupby("bill_no")["amount"].sum().mean(), 2))
print()

# --- 4. Question 1: which days are busy? ---------------------------------
# groupby() puts all the rows of one date together; sum() adds their amounts.
daily = df.groupby("date")["amount"].sum()

print("--- Busiest five days ---")
print(daily.sort_values(ascending=False).head(5).round(2))
print()

plt.figure(figsize=(9, 4))
plt.plot(daily.index, daily.values, marker="o", color="#e07b39")
plt.title("Day-wise sales, June 2026")
plt.xlabel("Date")
plt.ylabel("Sales (Rs)")
plt.xticks(rotation=45)
plt.grid(True, linestyle="--", alpha=0.5)
plt.tight_layout()
plt.savefig("chart1_daily_sales.png")
plt.close()

# --- 5. Question 2: which part of the shop earns? ------------------------
by_cat = df.groupby("category")["amount"].sum().sort_values(ascending=False)

print("--- Sales by category ---")
print(by_cat.round(2))
print()
# The share matters more than the rupees: it is what decides shelf space.
print("Share of the month's takings (%):")
print((by_cat / by_cat.sum() * 100).round(1))
print()

plt.figure(figsize=(8, 4.5))
plt.bar(by_cat.index, by_cat.values, color="#4c9f70")
plt.title("Sales by category, June 2026")
plt.xlabel("Category")
plt.ylabel("Sales (Rs)")
plt.xticks(rotation=20)
plt.tight_layout()
plt.savefig("chart2_category.png")
plt.close()

# --- 6. Question 3: which items are worth stocking? ----------------------
by_item = df.groupby("item")["amount"].sum().sort_values(ascending=False)

print("--- Top ten items by value ---")
print(by_item.head(10).round(2))
print()
print("--- Five slowest items ---")
print(by_item.tail(5).round(2))
print()

# barh() draws the bars sideways, so the long item names stay readable.
# [::-1] flips the order, putting the biggest bar at the top.
top10 = by_item.head(10)[::-1]
plt.figure(figsize=(8, 5))
plt.barh(top10.index, top10.values, color="#3b7dd8")
plt.title("Top ten items by value, June 2026")
plt.xlabel("Sales (Rs)")
plt.tight_layout()
plt.savefig("chart3_top_items.png")
plt.close()

# --- 7. Question 4: small bills or big ones? -----------------------------
# One row per bill, not per line, so a three-item bill counts once.
bills = df.groupby("bill_no")["amount"].sum()

print("--- Bill values ---")
print(bills.describe().round(2))
print()

plt.figure(figsize=(8, 4.5))
plt.hist(bills.values, bins=10, color="#a05fc0", edgecolor="white")
plt.title("How big is a bill? June 2026")
plt.xlabel("Value of a bill (Rs)")
plt.ylabel("Number of bills")
plt.tight_layout()
plt.savefig("chart4_bill_sizes.png")
plt.close()

# --- 8. Question 5: which day of the week is worth staffing? -------------
# .dt.day_name() reads the weekday out of a real date. This only works
# because parse_dates was used at step 1 — on plain text it would fail.
df["weekday"] = df["date"].dt.day_name()

# Adding the takings by weekday is not enough on its own: a month does not
# hold the same number of Mondays as Sundays. Dividing by how many of each
# day the month actually had gives a figure that can be compared.
order = ["Monday", "Tuesday", "Wednesday", "Thursday", "Friday", "Saturday", "Sunday"]
by_day = df.groupby("weekday")["amount"].sum().reindex(order)
how_many = df.groupby("weekday")["date"].nunique().reindex(order)
avg_day = (by_day / how_many).round(2)

print("--- Average takings by day of the week ---")
print(avg_day)
print()
print("Busiest day :", avg_day.idxmax(), "at Rs", avg_day.max())
print("Quietest day:", avg_day.idxmin(), "at Rs", avg_day.min())
print()

plt.figure(figsize=(8, 4.5))
plt.bar(avg_day.index, avg_day.values, color="#c9772f")
plt.title("Average takings by day of the week")
plt.xlabel("Day")
plt.ylabel("Average sales (Rs)")
plt.xticks(rotation=20)
plt.tight_layout()
plt.savefig("chart5_weekday.png")
plt.close()

# --- 9. Write the summary the shopkeeper keeps ---------------------------
# The charts are for the report; this file is what is actually handed over.
summary = pd.DataFrame({
    "sales": by_cat.round(2),
    "share_percent": (by_cat / by_cat.sum() * 100).round(1),
})
summary.to_csv("category_summary.csv")

print("Charts saved : chart1_daily_sales.png .. chart5_weekday.png")
print("Summary saved: category_summary.csv")The full report as a PDF, ready to print and fill in. Or the working project as a zip — the program, the dataset, the charts and a README.
10Sample output
A real run, reproduced exactly as it appeared. Nothing below was typed by hand — it is the transcript of the program above against the dataset in section 4.
Rows read from the file : 703
Columns                 : ['date', 'bill_no', 'item', 'category', 'qty', 'price']

Duplicate rows removed  : 2
Rows with no price      : 4 (dropped)
Rows left for analysis  : 697

Total sales for the month : Rs 95921.0
Number of bills           : 365
Average value of a bill   : Rs 262.8

--- Busiest five days ---
date
2026-06-21    5210.0
2026-06-29    4930.0
2026-06-06    4834.0
2026-06-02    4782.0
2026-06-04    4618.0
Name: amount, dtype: float64

--- Sales by category ---
category
Grocery          61328.0
Dairy            11686.0
Snacks            9125.0
Household         7319.0
Personal Care     6463.0
Name: amount, dtype: float64

Share of the month's takings (%):
category
Grocery          63.9
Dairy            12.2
Snacks            9.5
Household         7.6
Personal Care     6.7
Name: amount, dtype: float64

--- Top ten items by value ---
item
Rice 5kg           22320.0
Wheat flour 5kg    11515.0
Toor dal 1kg        9744.0
Refined oil 1L      8804.0
Tea 250g            5265.0
Detergent 1kg       5192.0
Toothpaste 100g     4048.0
Paneer 200g         3800.0
Sugar 1kg           3680.0
Milk 500ml          3052.0
Name: amount, dtype: float64

--- Five slowest items ---
item
Bath soap           2184.0
Soft drink 750ml    1620.0
Phenyl 500ml        1302.0
Dishwash bar         825.0
Shampoo sachet       231.0
Name: amount, dtype: float64

--- Bill values ---
count     365.00
mean      262.80
std       247.87
min         3.00
25%        88.00
50%       174.00
75%       355.00
max      1240.00
Name: amount, dtype: float64

--- Average takings by day of the week ---
weekday
Monday       2666.80
Tuesday      2279.00
Wednesday    3681.00
Thursday     3299.75
Friday       3631.25
Saturday     2947.00
Sunday       4239.00
dtype: float64

Busiest day : Sunday at Rs 4239.0
Quietest day: Tuesday at Rs 2279.0

Charts saved : chart1_daily_sales.png .. chart5_weekday.png
Summary saved: category_summary.csv
Running it also wrote category_summary.csv — 5 rows. This is the head of it:
category,sales,share_percent
Grocery,61328.0,63.9
Dairy,11686.0,12.2
Snacks,9125.0,9.5
Household,7319.0,7.6
Personal Care,6463.0,6.711The charts, and what each one says
CBSE asks for appropriate charts, and the word doing the work in that phrase is appropriate. A line for something that moves in order, a bar to compare things that do not, a histogram for the shape of one column of numbers. Each chart below says which it is, why that kind was chosen, and what it turned out to show.
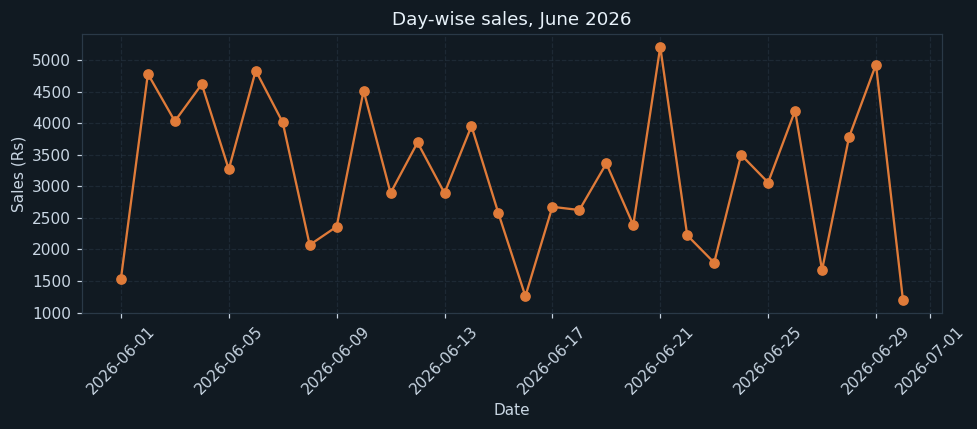
Each point is one day of June 2026; the height is everything the shop took that day. A line chart is right here because the days are in order and the reader is meant to follow the movement from one to the next.
The shop swings between about Rs 1,200 and Rs 5,200 in a day — a factor of four, on the same shelves, with the same stock. The best day of the month was 21 June at Rs 5,210 and the worst was 30 June at Rs 1,200.
There is no drift up or down across the month, which is worth saying plainly: the takings are not falling. What looks like chaos in this chart turns out to be a weekly pattern, and the fifth chart is what shows it.
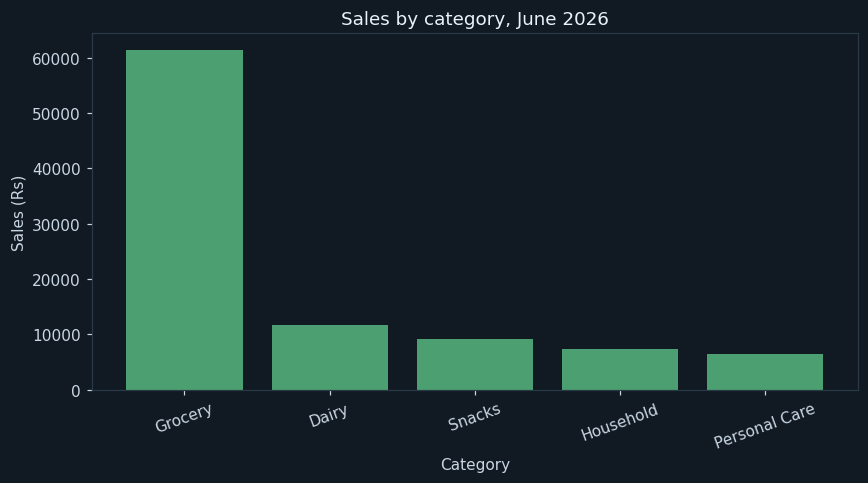
One bar per category, tallest first. A bar chart compares things that have no natural order, which is exactly what five categories are.
Grocery took Rs 61,328 of the month's Rs 95,921 — 63.9 per cent. Dairy is a distant second at 12.2 per cent, and the other three between them do not add up to a quarter.
The shopkeeper had said snacks were a big earner. Snacks are 9.5 per cent. They are visible all day at the counter, which is a very different thing from being profitable, and that gap between what feels busy and what earns is the single most useful thing this chart shows.
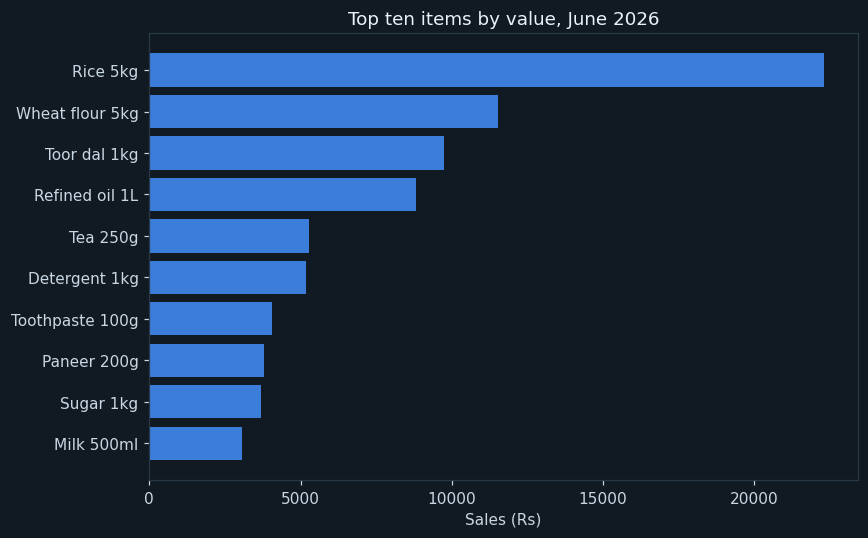
The same idea as the last chart but one level finer, and drawn sideways because item names do not fit under a vertical bar. The biggest is at the top.
Rice 5kg alone brought in Rs 22,320 — nearly a quarter of the month, from one line on one shelf. With wheat flour, toor dal and refined oil, four items account for over half the shop's takings.
The bottom of the same ranking is just as useful. Shampoo sachets earned Rs 231 in a month, dishwash bars Rs 825. They are not worthless — a sachet is what brings somebody in — but they should not be getting the shelf space that rice is not getting.
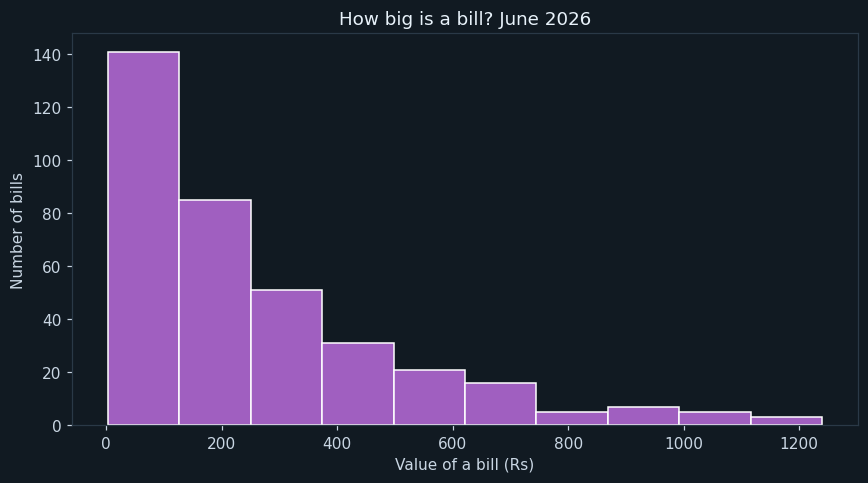
Bills are sorted into ten value bands, and the height of each bar is how many bills fell in that band. A histogram is for one column of numbers where the question is how they are spread — not what each one is.
The shape leans hard to the left. The median bill is Rs 174 while the mean is Rs 262.80, and the gap between those two numbers is the tail: a small number of large bills pulling the average up above what a typical customer actually spends.
The smallest bill of the month was Rs 3.00 — one shampoo sachet — and the largest Rs 1,240. Both are real customers. If the shop wants a bigger average bill, this chart says the opportunity is in the crowd at the left, not in chasing more big ones.
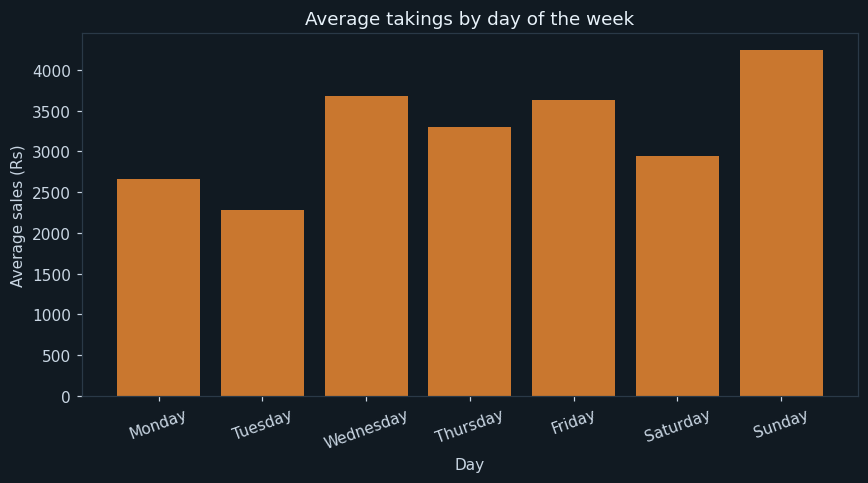
The month's takings collected by day of the week, then divided by how many of that weekday the month held — June 2026 has five Mondays and four Sundays, so the raw totals would be unfair.
Sunday averages Rs 4,239 and Tuesday Rs 2,279. Sunday is worth 1.86 Tuesdays, and the whole of the noise in the first chart is largely this one pattern.
That is a decision, not a curiosity. Deliveries and stock-taking belong on Tuesday, not Sunday, and if there is one day to have an extra pair of hands at the counter, this chart names it.
12What the analysis found
- The month came to Rs 95,921 over 365 bills, an average bill of Rs 262.80.
- Grocery is 63.9 per cent of the takings; snacks, which feel busy all day, are 9.5 per cent.
- Four items — rice, wheat flour, toor dal and refined oil — are over half the shop's earnings.
- The median bill is Rs 174 against a mean of Rs 262.80, so a few large bills are pulling the average up.
- Sunday takes Rs 4,239 on average against Tuesday's Rs 2,279 — 1.86 times as much.
- Six lines of the seven hundred were unusable: two entered twice, four with no price.
What should be done about them
This is the part that turns an analysis into a project. A chart that nobody acts on is a picture; a recommendation somebody can argue with is a result.
- Never run out of rice, wheat flour, toor dal or refined oil. Half the shop's income depends on four items being on the shelf.
- Move the deliveries and the stock-taking to Tuesday and keep Sunday clear for customers.
- Reconsider the shelf space given to shampoo sachets, dishwash bars and phenyl — together they are under Rs 2,400 a month.
- Fill the price column in every time. Four blank prices in one month is about Rs 700 of trade the shop cannot account for.
- Run the program again next month and compare. One month is a photograph; three months is evidence.
13Testing
Every case below was actually executed and its result recorded as it appeared — including the ones expected to fail. Each one builds a small dataset of its own and runs the whole program against it.
| Test case | Expected | Actual | Result |
|---|---|---|---|
| The full month, 703 rows | Total sales for the month : Rs 95921.0 | Total sales for the month : Rs 95921.0 | Pass |
| Bills counted once, not once per line | Number of bills : 365 | Number of bills : 365 | Pass |
| A file holding a single sale of 2 x Rs 46 | Total sales for the month : Rs 92.0 | Total sales for the month : Rs 92.0 | Pass |
| Three items on one bill count as one bill | Number of bills : 1 | Number of bills : 1 | Pass |
| ...and the bill's value is the three lines added up | Average value of a bill : Rs 94.0 | Average value of a bill : Rs 94.0 | Pass |
| The same line keyed in twice is removed | Duplicate rows removed : 1 | Duplicate rows removed : 1 | Pass |
| A row with no price is dropped, not counted as zero | Rows with no price : 1 (dropped) | Rows with no price : 1 (dropped) | Pass |
| ...and the total is the one good row only | Total sales for the month : Rs 46.0 | Total sales for the month : Rs 46.0 | Pass |
| Three spellings of one category are counted together | Snacks 105.0 | Snacks 105.0 | Pass |
| A weekday with no sales does not become a wrong average | Busiest day : Monday at Rs 46.0 | Busiest day : Monday at Rs 46.0 | Pass |
| sales.csv missing altogether | FileNotFoundError: [Errno 2] No such file or directory: 'sales.csv' | FileNotFoundError: [Errno 2] No such file or directory: 'sales.csv' | Pass |
Two kinds of case are in there on purpose. The boundary cases test the edge of a rule, where a program is most often wrong by one. The failure cases check that it stops cleanly and says why, instead of quietly producing a wrong answer.
14Advantages
Set against the ways the job is done today:
- The day book stops being write-only — the same data now answers questions
- The month's arithmetic is done identically every time, in about a second
- Bad rows are reported rather than silently included, so the shopkeeper learns what to fix
- Five charts a shopkeeper will actually look at, instead of a table they will not
- Nothing has to be bought or installed beyond Python; the shop keeps its own data
- Next month is one command, not another evening
15Limitations and future scope
What this version cannot tell you
A data project should be honest about the limits of its own data. Each of these is a reason for one of the additions below:
- It knows what was sold, not what it cost — so it reports takings, not profit
- One month at a time; there is no comparison with the month before
- The category has to be typed correctly, as there is no master list of items
- A returned item cannot be recorded, because there is no way to enter a negative sale
- The day of the week finding rests on one month, which held only four Sundays
What to add next
This is also where you make the project yours. Take one or two of these, or something nobody here thought of:
- Add a cost price column and report profit rather than takings
- Read several months and put them on one chart, so a trend can be seen
- Keep a master list of items so the category is looked up instead of typed
- Flag an item whose sales have fallen for three months running
- Let the shop enter returns as negative quantities and handle them properly
- Export the five charts into a single PDF the shopkeeper can be handed
16What you may have to teach yourself
CBSE expects some self-learning in a project and says so. For this one, that means:
- groupby() — the one pandas idea this whole project rests on. It is in the CBSE syllabus but is worth practising until it is second nature.
- How to read a histogram, and why the mean and the median disagree when the data has a tail
- savefig() and the difference between showing a chart and saving one
- How your local shop actually groups its items — go and ask; the categories here are a guess and yours should not be
17Conclusion
The program does what it set out to do. A month of a day book, typed into a file the shop already knows how to edit, comes back as five answers and five charts, and the arithmetic behind them is done the same way every time.
The result worth remembering is not any single figure but the gap between what the shopkeeper believed and what the file said. Snacks felt like the busy part of the shop and are a tenth of it; rice is a quarter of the income and gets a shelf like any other. Neither of those could be argued with once the chart was on the table.
The part of the work that took longest was not the analysis. It was the cleaning — two repeated lines, four blank prices and one category spelt three ways in seven hundred rows. That is a low rate of error for handwritten data, and it was still enough to have made three of the five answers wrong.
18References
Every report needs a bibliography, and a data project needs its data source at the top of it.
- The day book of a neighbourhood kirana shop, one month, copied with the owner's permission. The dataset shipped here is a LambdaLab sample standing in for it.
- pandas user guide, “Group by: split-apply-combine” — https://pandas.pydata.org/docs/user_guide/groupby.html
- Matplotlib pyplot tutorial — https://matplotlib.org/stable/tutorials/pyplot.html
- Informatics Practices, Class XII — the NCERT / CBSE prescribed textbook, for the chapters on data handling with pandas and data visualisation
- pandas documentation — https://pandas.pydata.org/docs/
- Matplotlib documentation — https://matplotlib.org/stable/
- CBSE Senior School Curriculum, Informatics Practices (Subject Code 065) — the project guidelines this report follows
- LambdaLab — https://www.lambdalab.in