The Water Complaint Register
A year of a municipal register — and one ward that complains nine times as often as the ward across town.
1Introduction: the problem it solves
A municipal water office writes every complaint into a register: which ward, what the problem was, the day it came in, the day it was closed. Two thousand three hundred of them in a year. The register is a legal record and nothing else — nobody reads it back, so nobody knows anything the register knows.
It knows which ward is worst served, once you allow for the fact that a big ward will always have more complaints than a small one. It knows what people actually complain about, which is not the same as what the office thinks. It knows how long the office really takes, against whatever target it has. And it knows which complaints are still open right now.
This project reads it out of MySQL and answers all four. The first answer is a difference between wards big enough that it is not really a maintenance question any more.
A ward councillor, a municipal engineer, a residents' association — anybody who has to argue for where the next repair budget goes.
Why it is worth doing on a computer
Repair budgets are argued for with anecdotes. A councillor who says their ward has bad water is answered by every other councillor saying the same thing, and the money goes wherever it went last year. Complaints per hundred households is a figure that ends that argument, and it cannot be produced by hand from a register.
The second reason is the pending list. A complaint still open is one where somebody has no water and is waiting, and it is the only row in the register with a deadline attached to it. Finding those means looking for a blank in the closed-date column across a year of pages. In pandas it is one condition, so the list can be produced every morning instead of never.
Objectives
- To read a year of complaints out of a MySQL database, with each ward's size alongside
- To compare wards fairly, by complaints per hundred households rather than by raw count
- To find what people actually complain about, and in what proportion
- To measure how long the office takes to close a complaint, against a three-day target
- To find which kinds of complaint the office is slowest at
- To keep the complaints that are still open, and produce them as a list sorted by how long they have waited
- To show how the load changes across the year, and whether it falls on every ward equally
2How the job is done today
Before writing anything it is worth asking how the work is handled at present, and where each of those answers falls short. These were examined:
The legal record, and where this data comes from. It is designed to prove a complaint was made, not to be read back, so a year of it answers nothing without being retyped.
How the argument is actually conducted. Every councillor is sincere and every one has anecdotes, so the anecdotes cancel out and the budget goes on precedent.
Many towns have one now, and it records complaints well. Its dashboards usually show counts by ward, which is the figure that flatters the small wards and hides the badly served ones.
The most accurate way of finding out which pipes are bad, and by far the most expensive. The register is already there and it is free.
3Where the data came from
CBSE asks that any resource used in a project be suitably referenced, and for a data project that rule is not a formality — a figure with no source attached to it does not mean anything. This section is the one an examiner will ask about.
The office keeps two tables. `wards` names each ward once and records how many households it has — that count is the whole reason the comparison can be made fair. `complaints` holds one row per complaint: the ward, the kind, the day it was logged and the day it was closed.
A complaint still open has NULL in closed_date. That NULL is not missing data, it is the current state of a real household without water, and everything in the second half of this project is built from those rows.
The register carries no names and no addresses, only the ward. That is deliberate: a complaint about water is a fact about a household, and a report that goes to a council meeting should carry the ward and not the door number. The database shipped here is a LambdaLab sample of 2,308 complaints across seven wards. Municipal records in India are usually obtainable — through the office, or under the Right to Information Act — and if you use real ones, say which office, which year, and how you got them.
4The dataset
Two tables, and the households column is what makes the project work. Without it the only comparison available is a raw count, which says nothing except which ward is biggest — and that is precisely the mistake the office had been making.
wards — one row per ward
| Field | Type | What it holds |
|---|---|---|
ward_id | INT PRIMARY KEY | The ward's id. What `complaints` points at. |
ward_name | VARCHAR(40) | The ward's name. |
households | INT | How many households it holds. The denominator that makes wards comparable. |
complaints — one row per complaint
| Field | Type | What it holds |
|---|---|---|
complaint_id | INT PRIMARY KEY | The complaint's own id. |
ward_id | INT, FOREIGN KEY | Which ward. Must exist in `wards`. |
complaint_type | VARCHAR(30) | No supply, low pressure, leakage, dirty water, burst pipeline, billing error or illegal connection. |
logged_date | DATE | The day the complaint came in. |
closed_date | DATE, may be NULL | The day it was closed. NULL while it is still open. |
The tables, as the schema creates them
Creates both tables and loads the sample rows — 7 wards and 2,308 complaints. Load it with one command before running the program. The whole file is 2,315 rows, 121.0 KB — too much to print here, so this is the structure it creates. The complete file comes with the download, and you can also take it on its own.
-- ---------------------------------------------------------------------
-- schema.sql  --  the municipal water supply complaint register
--
-- Two tables. `wards` names each ward once and says how many households it
-- has; `complaints` records one row per complaint, pointing at its ward by
-- id. A complaint still open has NULL in closed_date, and that NULL is what
-- the pending list is built from.
--
-- Load it with:   mysql -u root -p < schema.sql
-- ---------------------------------------------------------------------

CREATE DATABASE IF NOT EXISTS lambdalab_water;
USE lambdalab_water;

DROP TABLE IF EXISTS complaints;
DROP TABLE IF EXISTS wards;

CREATE TABLE wards (
    ward_id    INT PRIMARY KEY,
    ward_name  VARCHAR(40) NOT NULL,
    households INT         NOT NULL   -- so wards of different sizes compare fairly
);

CREATE TABLE complaints (
    complaint_id   INT PRIMARY KEY,
    ward_id        INT  NOT NULL,
    complaint_type VARCHAR(30) NOT NULL,
    logged_date    DATE NOT NULL,
    closed_date    DATE,              -- NULL while the complaint is still open
    FOREIGN KEY (ward_id) REFERENCES wards(ward_id)
);
The rows themselves follow in the same file, as ordinary INSERT statements. These are the first few:
INSERT INTO wards VALUES
(1, 'Ward 1 Civil Lines', 880),
(2, 'Ward 2 Sector 9', 1240),
(3, 'Ward 3 Railway Colony', 640),
(4, 'Ward 4 Krishna Nagar', 980),
(5, 'Ward 5 Old Town', 720),5Cleaning the data
Real data arrives with mistakes in it, and this dataset has the ones real data actually has. What was wrong, how much of it there was, and what the program does about each — because how a problem is handled changes the answer, and a report has to say which choice it made.
pd.to_datetime(..., errors="coerce") turns those NULLs into NaT instead of stopping the program, so the rows survive. A dropna here would delete every complaint that is still waiting — the only rows in the file that anybody is owed anything about.
Two frames: `closed` for the how-long figures, and a separate one for the pending list, where the clock runs to today rather than to a closing date. Two questions, two subsets.
Dividing by the households column. Ward 2 Sector 9 has 242 complaints and Ward 3 Railway Colony has 372, so by raw count Ward 3 looks worse — and per hundred households the difference is 19.5 against 58.1, which is three times as bad, not one and a half.
to_datetime on each, so the program does not depend on which database is behind it.
6What the program does
- Connects to MySQL and reads a year of complaints with each ward's size joined on
- Keeps the complaints that are still open rather than cleaning the NULLs away
- Ranks wards by complaints per hundred households, and by raw count, and shows they differ
- Breaks complaints down by kind, with each one's share
- Measures how long the office takes to close a complaint against a three-day target
- Compares the kinds of complaint by how long each takes
- Lists the complaints still open, sorted by how long they have waited
- Charts the year's load for the whole town and for its three worst wards together
- Writes the pending list and the ward summary out as CSV files
The pandas and pyplot it is built from
| Call | Where | What it is for |
|---|---|---|
mysql.connector.connect() | step 1 | Opens the database from Python |
JOIN ... ON c.ward_id = w.ward_id | step 2 | Brings each ward's name and size alongside its complaints |
pd.read_sql(query, con) | step 2 | Sends the SQL and gets a DataFrame back |
pd.to_datetime(s, errors="coerce") | step 3 | A NULL becomes NaT instead of stopping the program |
(a - b).dt.days | step 4 | How many days a complaint took |
df.groupby(c).agg(name=(col, how)) | step 5 | Complaints and households per ward in one pass |
count / households * 100 | step 5 | The line that makes wards of different sizes comparable |
df[df[c].isnull()] | step 6 | The complaints still open — the ones a dropna would have deleted |
df.dropna(subset=[...]) | step 6 | The closed ones, for the how-long figures |
Series.dt.to_period("M") | step 7 | Groups a whole month together |
df.pivot_table(index=, columns=) | step 7 | Months down the side, wards across the top, for the multi-line chart |
Series.isin([...]) | step 7 | Keeps only the three wards being charted |
(series <= 3).mean() * 100 | step 6 | The share closed inside the target, in one step |
plt.axhline() / plt.axvline() | charts 3, 4 | The three-day target drawn across the chart |
DataFrame.to_csv() | step 7 | Writes the pending list and the ward summary out |
7Technical details
| Language | Python 3 |
| Where the data lives | MySQL, read into pandas through mysql-connector-python |
| Libraries |
|
8How it works, step by step
mysql.connector.connect() opens the water office's database.
One read_sql with a JOIN brings every complaint together with its ward's name and household count, so nothing has to be looked up twice.
to_datetime on both dates, with errors="coerce" on the closing date so the open complaints become NaT and survive into the analysis.
days_taken is the gap between the two dates. It is NaT for an open complaint, which is correct — that complaint has not taken any number of days yet.
Each ward's complaint count divided by its households and multiplied by a hundred. This one line is what turns the register into an argument.
One frame of closed complaints for the speed figures, one of open ones for the pending list, where the clock runs to the day the register was read.
Five charts — a horizontal bar, two bars, a histogram and a multi-line — each saved with savefig().
9Source code
The whole program. Every chart further down this page was drawn by this listing, and every figure quoted came out of running it.
# ---------------------------------------------------------------------------
# complaint_analysis.py
#
# The municipal water office writes every complaint into a register and never
# reads it back. A year of it is in MySQL here, and this program asks the five
# questions a ward councillor would ask if anybody gave them the figures:
#
#   1. Which ward complains most, once its size is allowed for?
#   2. What do people complain about?
#   3. How long does the office take to close a complaint?
#   4. Which kind of complaint is the office slowest at?
#   5. When in the year does the department get overwhelmed?
#
# A complaint that is still open has NULL in closed_date. Those rows are the
# most important ones in the file, so nothing here is allowed to drop them
# quietly.
# ---------------------------------------------------------------------------

import mysql.connector
import pandas as pd
import matplotlib.pyplot as plt

TODAY = pd.Timestamp("2026-03-31")      # the day the register was read

pd.set_option("display.width", 118)
pd.set_option("display.max_columns", 12)

# --- 1. Connect and read -------------------------------------------------
con = mysql.connector.connect(
    host="localhost",
    user="root",
    password="your_password_here",
    database="lambdalab_water",
)

# The JOIN brings the ward's name and size alongside every complaint, so the
# analysis never has to look anything up a second time.
df = pd.read_sql(
    "SELECT c.complaint_id, c.complaint_type, c.logged_date, c.closed_date, "
    "       w.ward_name, w.households "
    "FROM complaints c JOIN wards w ON c.ward_id = w.ward_id",
    con)
con.close()

print("Complaints in the register :", len(df))
print("Wards                      :", df["ward_name"].nunique())
print()

df["logged_date"] = pd.to_datetime(df["logged_date"])
# errors="coerce" keeps the open complaints in the table as NaT instead of
# stopping the program. They have to survive: they are the pending list.
df["closed_date"] = pd.to_datetime(df["closed_date"], errors="coerce")

open_now = df["closed_date"].isnull().sum()
print("Still open on", TODAY.date(), ":", open_now,
      "(", round(open_now / len(df) * 100, 1), "% )")
print()

# --- 2. Derive: how long each one took -----------------------------------
df["days_taken"] = (df["closed_date"] - df["logged_date"]).dt.days
closed = df.dropna(subset=["days_taken"])

# --- 3. Question 1: which ward? ------------------------------------------
ward = df.groupby("ward_name").agg(
    complaints=("complaint_id", "count"),
    households=("households", "max"),
).round(2)
# The figure that makes the wards comparable. A big ward will always have
# more complaints; complaints per hundred households says whether its water
# is actually worse.
ward["per_100_homes"] = (ward["complaints"] / ward["households"] * 100).round(1)
ward = ward.sort_values("per_100_homes", ascending=False)

print("--- Complaints by ward ---")
print(ward)
print()
print("Worst ward:", ward.index[0], "at", ward.iloc[0]["per_100_homes"],
      "complaints per 100 homes")
print("Best ward :", ward.index[-1], "at", ward.iloc[-1]["per_100_homes"])
print("The worst ward complains", round(ward.iloc[0]["per_100_homes"] /
      ward.iloc[-1]["per_100_homes"], 1), "times as often as the best.")
print()

plt.figure(figsize=(9, 5))
plt.barh(ward.index[::-1], ward["per_100_homes"][::-1], color="#2f8fa8")
plt.title("Water complaints per 100 households, ward by ward")
plt.xlabel("Complaints per 100 households in the year")
plt.tight_layout()
plt.savefig("chart1_wards.png")
plt.close()

# --- 4. Question 2: what do people complain about? -----------------------
by_type = df.groupby("complaint_type")["complaint_id"].count().sort_values(ascending=False)

print("--- Complaints by kind ---")
print(by_type)
print()
print("Share (%):")
print((by_type / by_type.sum() * 100).round(1))
print()

plt.figure(figsize=(9, 4.5))
plt.bar(by_type.index, by_type.values, color="#4c9f70")
plt.title("What people complain about")
plt.xlabel("Kind of complaint")
plt.ylabel("Complaints in the year")
plt.xticks(rotation=25, ha="right")
plt.tight_layout()
plt.savefig("chart2_types.png")
plt.close()

# --- 5. Question 3: how long does it take? -------------------------------
print("--- Days taken to close a complaint ---")
print(closed["days_taken"].describe().round(2))
print()
print("Closed the same day  :", (closed["days_taken"] == 0).sum())
if len(closed) > 0:
    print("Closed within 3 days :", (closed["days_taken"] <= 3).sum(),
          "(", round((closed["days_taken"] <= 3).mean() * 100, 1), "% )")
print("Took more than 2 weeks:", (closed["days_taken"] > 14).sum())
print()

# Complaints still open, counted by how long they have been waiting.
still = df[df["closed_date"].isnull()].copy()
still["waiting"] = (TODAY - still["logged_date"]).dt.days
print("--- Complaints still open, by how long they have waited ---")
print(still["waiting"].describe().round(1))
print()

if len(closed) > 0:
    plt.figure(figsize=(8.5, 4.5))
    plt.hist(closed["days_taken"].values, bins=16, color="#a05fc0", edgecolor="white")
    plt.axvline(3, color="#c0392b", linestyle="--", label="3-day target")
    plt.title("How long the office takes to close a complaint")
    plt.xlabel("Days taken")
    plt.ylabel("Number of complaints")
    plt.legend()
    plt.tight_layout()
    plt.savefig("chart3_days_taken.png")
    plt.close()

# --- 6. Question 4: which kind is it slowest at? -------------------------
speed = closed.groupby("complaint_type")["days_taken"].agg(
    ["count", "mean", "median", "max"]).round(2).sort_values("mean", ascending=False)

print("--- Days taken, by kind of complaint ---")
print(speed)
print()

plt.figure(figsize=(9, 4.5))
plt.bar(speed.index, speed["mean"], color="#c9772f")
plt.axhline(3, color="#c0392b", linestyle="--", label="3-day target")
plt.title("Average days to close, by kind of complaint")
plt.xlabel("Kind of complaint")
plt.ylabel("Average days taken")
plt.xticks(rotation=25, ha="right")
plt.legend()
plt.tight_layout()
plt.savefig("chart4_speed_by_type.png")
plt.close()

# --- 7. Question 5: when is the office overwhelmed? ----------------------
df["month"] = df["logged_date"].dt.to_period("M").astype(str)
monthly = df.groupby("month")["complaint_id"].count()
monthly_speed = closed.assign(
    month=closed["logged_date"].dt.to_period("M").astype(str)
).groupby("month")["days_taken"].mean().round(2)

print("--- Complaints logged, month by month ---")
print(monthly)
print()
print("--- and the average days taken to close them ---")
print(monthly_speed)
print()
print("Busiest month :", monthly.idxmax(), "with", monthly.max(), "complaints")
print("Quietest month:", monthly.idxmin(), "with", monthly.min(), "complaints")
# A register in which nothing has been closed yet is what the first week of a
# new office looks like, and it is what these two guards are for: idxmax on an
# empty Series stops the program rather than returning nothing.
if len(monthly_speed) > 0:
    print("Slowest month :", monthly_speed.idxmax(), "at",
          monthly_speed.max(), "days on average")
else:
    print("Slowest month : nothing has been closed yet")
print()

# Three lines on one chart: the summer surge does not fall on every ward
# equally, and that is the whole argument for spending money on one of them.
worst3 = list(ward.index[:3])
by_ward_month = df[df["ward_name"].isin(worst3)].pivot_table(
    index="month", columns="ward_name", values="complaint_id", aggfunc="count")

print("--- The three worst wards, month by month ---")
print(by_ward_month)
print()

plt.figure(figsize=(9.5, 4.5))
plt.plot(monthly.index, monthly.values, marker="o", color="#888888",
         linestyle="--", label="All wards")
for w in worst3:
    plt.plot(by_ward_month.index, by_ward_month[w], marker="o", label=w)
plt.title("Complaints logged each month: the whole town, and its worst three wards")
plt.xlabel("Month")
plt.ylabel("Complaints logged")
plt.xticks(rotation=45)
plt.legend(fontsize=8)
plt.grid(True, linestyle="--", alpha=0.5)
plt.tight_layout()
plt.savefig("chart5_monthly.png")
plt.close()

# --- 8. The list the office should act on --------------------------------
still[["complaint_id", "ward_name", "complaint_type", "logged_date", "waiting"]] \
    .sort_values("waiting", ascending=False).to_csv("pending.csv", index=False)
ward.to_csv("ward_summary.csv")

print("Charts saved : chart1_wards.png .. chart5_monthly.png")
print("Lists saved : pending.csv, ward_summary.csv")The full report as a PDF, ready to print and fill in. Or the working project as a zip — the program, the dataset, the charts and a README.
10Sample output
A real run, reproduced exactly as it appeared. Nothing below was typed by hand — it is the transcript of the program above against the dataset in section 4.
Complaints in the register : 2308
Wards                      : 7

Still open on 2026-03-31 : 30 ( 1.3 % )

--- Complaints by ward ---
                       complaints  households  per_100_homes
ward_name
Ward 7 Indira Basti           497         540           92.0
Ward 5 Old Town               592         720           82.2
Ward 3 Railway Colony         372         640           58.1
Ward 4 Krishna Nagar          409         980           41.7
Ward 2 Sector 9               242        1240           19.5
Ward 1 Civil Lines             90         880           10.2
Ward 6 Green Park             106        1100            9.6

Worst ward: Ward 7 Indira Basti at 92.0 complaints per 100 homes
Best ward : Ward 6 Green Park at 9.6
The worst ward complains 9.6 times as often as the best.

--- Complaints by kind ---
complaint_type
No supply             602
Low pressure          528
Leakage               418
Dirty water           332
Billing error         161
Burst pipeline        152
Illegal connection    115
Name: complaint_id, dtype: int64

Share (%):
complaint_type
No supply             26.1
Low pressure          22.9
Leakage               18.1
Dirty water           14.4
Billing error          7.0
Burst pipeline         6.6
Illegal connection     5.0
Name: complaint_id, dtype: float64

--- Days taken to close a complaint ---
count    2278.00
mean        7.80
std         6.37
min         0.00
25%         3.00
50%         7.00
75%        11.00
max        46.00
Name: days_taken, dtype: float64

Closed the same day  : 216
Closed within 3 days : 629 ( 27.6 % )
Took more than 2 weeks: 312

--- Complaints still open, by how long they have waited ---
count    30.0
mean      7.6
std       8.6
min       0.0
25%       2.0
50%       5.0
75%      11.2
max      40.0
Name: waiting, dtype: float64

--- Days taken, by kind of complaint ---
                    count   mean  median   max
complaint_type
Burst pipeline        148  14.23    13.5  45.0
Illegal connection    113  13.47    12.0  46.0
Low pressure          520   8.59     8.0  35.0
Leakage               414   7.23     6.0  27.0
No supply             595   7.09     6.0  25.0
Dirty water           329   5.83     5.0  21.0
Billing error         159   3.41     3.0  13.0

--- Complaints logged, month by month ---
month
2025-04    235
2025-05    396
2025-06    353
2025-07    243
2025-08    139
2025-09    135
2025-10    133
2025-11    135
2025-12    137
2026-01    130
2026-02    129
2026-03    143
Name: complaint_id, dtype: int64

--- and the average days taken to close them ---
month
2025-04    7.52
2025-05    7.39
2025-06    7.79
2025-07    8.45
2025-08    7.99
2025-09    7.66
2025-10    7.89
2025-11    8.38
2025-12    7.49
2026-01    8.38
2026-02    9.16
2026-03    5.74
Name: days_taken, dtype: float64

Busiest month : 2025-05 with 396 complaints
Quietest month: 2026-02 with 129 complaints
Slowest month : 2026-02 at 9.16 days on average

--- The three worst wards, month by month ---
ward_name  Ward 3 Railway Colony  Ward 5 Old Town  Ward 7 Indira Basti
month
2025-04                       42               53                   45
2025-05                       63               99                   80
2025-06                       50               89                   81
2025-07                       39               59                   56
2025-08                       19               37                   33
2025-09                       22               36                   30
2025-10                       19               40                   25
2025-11                       23               38                   26
2025-12                       22               37                   25
2026-01                       24               35                   28
2026-02                       23               41                   31
2026-03                       26               28                   37

Charts saved : chart1_wards.png .. chart5_monthly.png
Lists saved : pending.csv, ward_summary.csvschema.sql into MySQL and change the user and password in the connect() call to your own.Running it also wrote pending.csv — 30 rows. This is the head of it:
complaint_id,ward_name,complaint_type,logged_date,waiting
2130,Ward 5 Old Town,Burst pipeline,2026-02-19,40
2211,Ward 5 Old Town,Low pressure,2026-03-09,22
2229,Ward 7 Indira Basti,Low pressure,2026-03-13,18
2240,Ward 5 Old Town,No supply,2026-03-15,16
2241,Ward 7 Indira Basti,Burst pipeline,2026-03-15,16
2244,Ward 7 Indira Basti,Low pressure,2026-03-16,15
2257,Ward 5 Old Town,Low pressure,2026-03-19,12
2258,Ward 7 Indira Basti,Burst pipeline,2026-03-19,12
2266,Ward 3 Railway Colony,Illegal connection,2026-03-22,9
Running it also wrote ward_summary.csv — 7 rows. This is the head of it:
ward_name,complaints,households,per_100_homes
Ward 7 Indira Basti,497,540,92.0
Ward 5 Old Town,592,720,82.2
Ward 3 Railway Colony,372,640,58.1
Ward 4 Krishna Nagar,409,980,41.7
Ward 2 Sector 9,242,1240,19.5
Ward 1 Civil Lines,90,880,10.2
Ward 6 Green Park,106,1100,9.611The charts, and what each one says
CBSE asks for appropriate charts, and the word doing the work in that phrase is appropriate. A line for something that moves in order, a bar to compare things that do not, a histogram for the shape of one column of numbers. Each chart below says which it is, why that kind was chosen, and what it turned out to show.
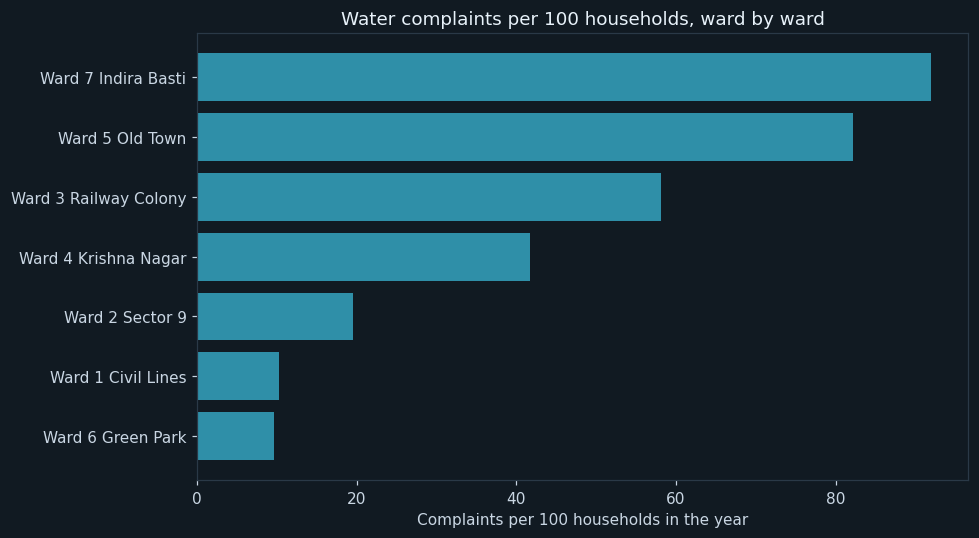
Complaints per hundred households in the year, ward by ward, worst at the top. Per hundred households, not per ward — that is the whole chart, and it is the difference between a fair comparison and a misleading one.
Ward 7 Indira Basti had 92.0 complaints per hundred households in the year. Ward 6 Green Park had 9.6. The worst-served ward complains 9.6 times as often as the best-served one, in the same town, from the same water system.
By raw count Ward 7 does not look like the worst at all — it has 497 complaints against Ward 5's 592, and it is the smallest ward in the town. Counting complaints rewards being small. Almost a complaint per household per year is not a maintenance backlog; it is a ward whose water supply does not work, and a chart drawn the other way round would have hidden it completely.
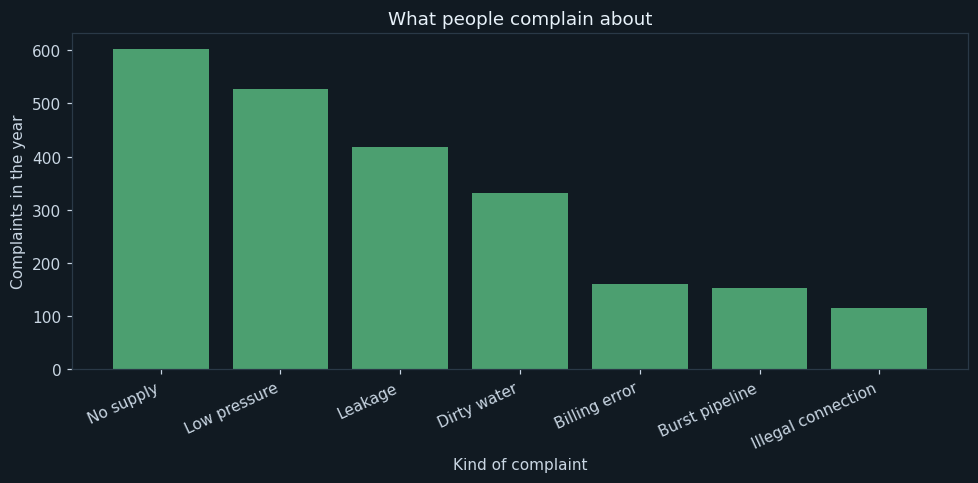
Complaints by kind for the whole year, largest first. Bars, because the kinds have no natural order.
No supply is the largest at 602 complaints, 26.1 per cent of everything, and low pressure follows at 528. Between them those two are nearly half the register.
That split matters for who should act on it. No supply and low pressure are both about water not arriving — a mains, a pump or a schedule problem. Leakage, dirty water and burst pipelines, which together are 39.1 per cent, are about the pipes themselves. Billing errors are 7 per cent and are not an engineering problem at all. The register had been treated as one queue; it is really three, and two of them belong to different departments.
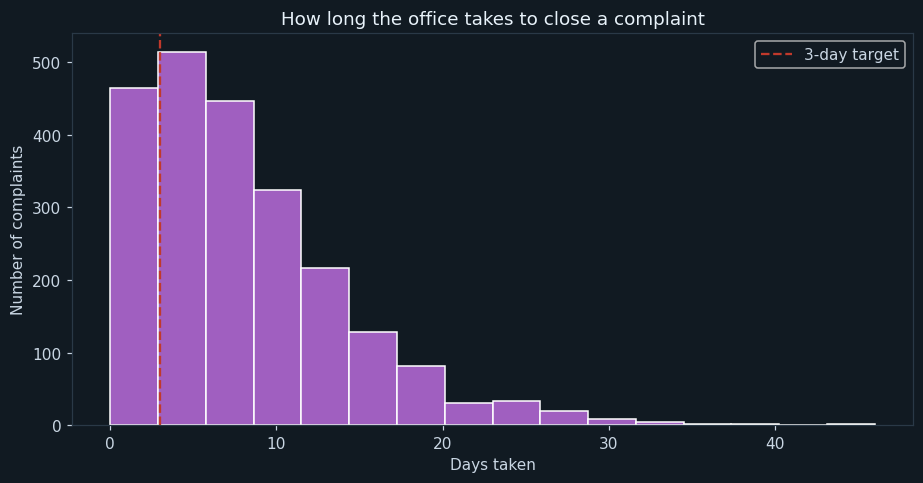
Every closed complaint sorted by how many days it took, with a dashed line at the three-day target. Everything right of that line missed it.
The median complaint takes 7 days and the average 7.8. Only 27.6 per cent were closed within three days, so the office misses its own target on nearly three complaints in four.
The tail is the part to act on: 312 complaints took more than a fortnight and the longest took 46 days. Two hundred and sixteen were closed the same day, so the office is perfectly capable of moving quickly. The question the chart raises is not whether it is slow but why the same office produces both ends of this distribution.
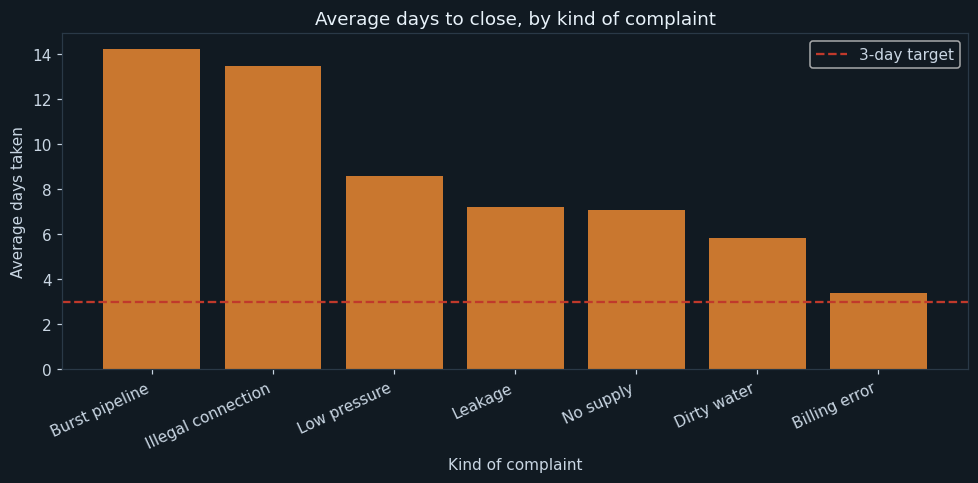
Average days to close, by kind of complaint, slowest first, with the three-day target drawn across. The previous chart said the office is slow; this one says where.
Burst pipelines take 14.23 days on average and illegal connections 13.47 — roughly twice everything else. Billing errors take 3.41 days, which is almost the target.
The ordering is sensible and that is worth saying: a burst pipeline is a dig and a repair, and it should take longer than correcting a bill. But fourteen days is a long time for a burst main, and the maximum in that category is 45 days. This is the chart that says where extra crews or contracted help would actually change something.
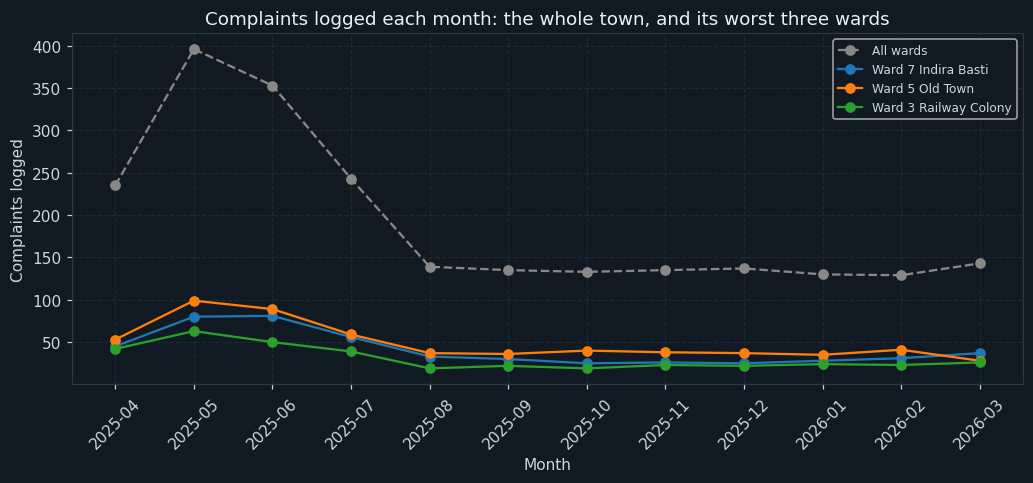
Complaints logged each month for the whole town, with the three worst wards drawn separately. Four lines, and the comparison between the dashed total and the individual wards is the point.
The town's load nearly triples in summer: 396 complaints in May against 129 in February. Every ward feels it, which is what a water system under seasonal stress looks like.
The three worst wards do not feel it equally. Ward 5 Old Town goes from about 37 complaints a month to 99 in May, and Ward 7 Indira Basti from 25 to 81 — more than tripling. These are the same wards that were already worst in the annual chart, so the summer does not spread the problem out, it concentrates it. Whatever the office does before next May, doing it in those two wards is worth more than doing it everywhere.
12What the analysis found
- 2,308 complaints in the year, and 30 were still open on the day the register was read.
- Ward 7 Indira Basti had 92.0 complaints per hundred households; Ward 6 Green Park had 9.6.
- By raw count Ward 7 is not the worst ward — counting complaints rewards being small.
- No supply and low pressure together are 49 per cent of the register.
- The median complaint takes 7 days, and only 27.6 per cent are closed inside the three-day target.
- Burst pipelines average 14.23 days and billing errors 3.41.
- Complaints nearly triple in summer, from 129 in February to 396 in May, and the surge falls hardest on the wards that were already worst.
What should be done about them
This is the part that turns an analysis into a project. A chart that nobody acts on is a picture; a recommendation somebody can argue with is a result.
- Spend the next repair budget in Ward 7 Indira Basti and Ward 5 Old Town. The per-household figures make that case in one chart.
- Stop reporting complaints by raw count. It has been telling the office the opposite of the truth about which ward needs help.
- Split the register into three queues — supply, pipes and billing — and route each to the department that can actually close it.
- Put extra crews on burst pipelines, where the office is slowest by a factor of two.
- Do the preventive work in March and April, before the May surge, and do it in the two wards the surge hits hardest.
- Produce the pending list every morning. Thirty open complaints is thirty households waiting, and one has been waiting 40 days.
13Testing
Every case below was actually executed and its result recorded as it appeared — including the ones expected to fail. Each one builds a small dataset of its own and runs the whole program against it.
| Test case | Expected | Actual | Result |
|---|---|---|---|
| The full register, 2308 complaints | Complaints in the register : 2308 | Complaints in the register : 2308 | Pass |
| Complaints still open survive the cleaning | Still open on 2026-03-31 : 30 ( 1.3 % ) | Still open on 2026-03-31 : 30 ( 1.3 % ) | Pass |
| The office's own three-day target, measured | Closed within 3 days : 629 ( 27.6 % ) | Closed within 3 days : 629 ( 27.6 % ) | Pass |
| The worst-served ward, per hundred households | Worst ward: Ward 7 Indira Basti at 92.0 complaints per 100 homes | Worst ward: Ward 7 Indira Basti at 92.0 complaints per 100 homes | Pass |
| The big ward has twice the complaints | Ward A Big 20 1000 2.0 | Ward A Big 20 1000 2.0 | Pass |
| ...and the small one is five times worse served | Ward B Small 10 100 10.0 | Ward B Small 10 100 10.0 | Pass |
| ...so the ranking by rate is the opposite of the ranking by count | Worst ward: Ward B Small at 10.0 complaints per 100 homes | Worst ward: Ward B Small at 10.0 complaints per 100 homes | Pass |
| A complaint with no closing date is kept in the register | Still open on 2026-03-31 : 1 ( 50.0 % ) | Still open on 2026-03-31 : 1 ( 50.0 % ) | Pass |
| ...and is not counted among the closed ones | count 1.0 | count 1.0 | Pass |
| Exactly 3 days is inside the target, 4 days is not | Closed within 3 days : 1 ( 50.0 % ) | Closed within 3 days : 1 ( 50.0 % ) | Pass |
| A complaint closed the same day takes zero days, not one | Closed the same day : 1 | Closed the same day : 1 | Pass |
| An open complaint's wait is measured to the day the register was read | max 30.0 | max 30.0 | Pass |
Two kinds of case are in there on purpose. The boundary cases test the edge of a rule, where a program is most often wrong by one. The failure cases check that it stops cleanly and says why, instead of quietly producing a wrong answer.
14Advantages
Set against the ways the job is done today:
- Wards are compared per household, which is the only comparison that is fair between wards of different sizes
- A budget argument gets a number instead of competing anecdotes
- Complaints still open are kept rather than cleaned away, which is where a careless version of this would go wrong
- The pending list becomes a daily job instead of a quarterly one
- The office's own target is measured against its own record
- The register carries no names or addresses, so the analysis can be published as it stands
15Limitations and future scope
What this version cannot tell you
A data project should be honest about the limits of its own data. Each of these is a reason for one of the additions below:
- It counts complaints, not problems. A ward that has given up complaining looks well served.
- "Closed" means the office marked it closed, which is not the same as the household having water
- Household counts are taken as fixed for the year
- There is no severity, so one house without water for a day and a whole street for a week count the same
- One town and one year
What to add next
This is also where you make the project yours. Take one or two of these, or something nobody here thought of:
- Add a severity or a number of households affected, so the queue can be ordered by who is worst off
- Record repeat complaints from the same connection, which is the sign of a fault that was never really fixed
- Compare complaint rates against the age of the pipes in each ward, if the engineering department has that
- Send the pending list to the ward engineer automatically every morning
- Compare two years and see whether money spent in a ward reduced its complaints
- Put the per-household chart on the municipality's public dashboard, which is where an argument settled by figures belongs
16What you may have to teach yourself
CBSE expects some self-learning in a project and says so. For this one, that means:
- Why a rate beats a count whenever the things being compared are different sizes. It is the same lesson as the per-flat average in the electricity project, and here it reverses the answer completely.
- NULL and NaT, and errors="coerce" — the line that lets the pending half of this project exist
- Splitting one file into two frames for two questions that cannot use the same rows
- How to obtain municipal records: ask the office first, and know that the Right to Information Act exists if they say no
17Conclusion
The program does what it set out to do. A year of a paper register, retyped into two tables, comes back as five charts and two working lists, and the questions a council argues about have figures attached to them.
The finding that justifies the project is a single division. Ward 7 Indira Basti has 497 complaints and Ward 5 Old Town has 592, so by the count the office had been using, Ward 5 is the problem. Divide by households and Ward 7 is at 92.0 per hundred against Ward 5's 82.2, and both are nine and eight times Ward 6's 9.6. Ward 7 is the smallest ward in the town, which is exactly why counting complaints had been hiding it. Almost one complaint per household per year is not a backlog to work through; it is a supply that does not work, in the ward least able to argue about it.
The part that had to be got right was the NULLs, and it is the same lesson as the library project from the other direction. Thirty complaints have no closing date because nobody has closed them, and the obvious cleaning step would have deleted precisely those thirty rows — the only ones in the file where somebody is still waiting. The program keeps them, splits the register into two frames, and answers the two questions from different halves of it.
18References
Every report needs a bibliography, and a data project needs its data source at the top of it.
- The complaint register of a municipal water department, one year. The database shipped here is a LambdaLab sample standing in for it and contains no names or addresses.
- The Right to Information Act, 2005 — the route to municipal records if the office will not give them directly
- MySQL 8.0 Reference Manual — https://dev.mysql.com/doc/refman/8.0/en/
- pandas user guide, “Working with missing data” — https://pandas.pydata.org/docs/user_guide/missing_data.html
- Informatics Practices, Class XII — the NCERT / CBSE prescribed textbook, for the chapters on data handling with pandas, database query using SQL, and data visualisation
- pandas documentation — https://pandas.pydata.org/docs/
- Matplotlib documentation — https://matplotlib.org/stable/
- CBSE Senior School Curriculum, Informatics Practices (Subject Code 065) — the project guidelines this report follows
- LambdaLab — https://www.lambdalab.in