Screen Time, Sleep and Marks
Three hundred students answered six questions — and the answers are more careful than the headlines about them.
1Introduction: the problem it solves
Every school assembly has a talk about phones. It is delivered with total confidence and no evidence, usually as a single sentence: phones are ruining your sleep and your marks. The students have heard it, they do not believe it, and nobody in the hall has any figures.
The figures are obtainable. Three hundred students, six questions on one sheet of paper, twenty minutes of a form period — and the school has its own data about its own children rather than a statistic from somewhere else.
This project analyses that survey. It asks how much screen time a student really has, whether it grows with age, whether it tracks sleep, whether there is anything in the file connecting it to marks, and who owns the phone. The answers are clear enough to act on and much more careful than the assembly speech.
A school that wants to say something about phones to its students and its parents, and would rather say something true than something loud.
Why it is worth doing on a computer
The argument for computerising is not the arithmetic — it is that a survey read by eye tells you what you went in believing. Three hundred forms is enough that nobody reads them all; somebody flicks through, sees a few students with six hours and poor marks, and reports what they saw. The program looks at every form, including the ones that do not fit.
It matters more here than anywhere else in these ten projects, because this is the one whose findings are about people. A number quoted in an assembly gets repeated for years. Getting it right, and stating what it does not prove, is part of the work — and the program is what makes both possible.
Objectives
- To read three hundred survey responses out of one CSV file
- To report exactly which questions were left blank, and how many, before quoting any result
- To describe the spread of screen time across the school
- To compare the classes, and see whether screen time grows with age
- To measure how screen time and sleep move together
- To look for any relationship between screen time and the last examination's marks, and to report its limits honestly
- To find which device students mainly use, and whether that changes anything
2How the job is done today
Before writing anything it is worth asking how the work is handled at present, and where each of those answers falls short. These were examined:
Confident, evidence-free and disbelieved. It quotes a statistic from a newspaper about children somewhere else, which is exactly the thing a student can dismiss.
Real research, and worth reading and citing. It is about other populations in other countries, and a student can always say it is not about them. A survey of their own school cannot be dismissed that way.
Every phone measures this accurately, which is better than asking. Collecting three hundred of them means going through three hundred children's phones, which is not something a school should be doing.
What normally happens to a school survey. Three hundred forms by hand gives you totals and stops there, and it takes long enough that the interesting cross-questions never get asked.
3Where the data came from
CBSE asks that any resource used in a project be suitably referenced, and for a data project that rule is not a formality — a figure with no source attached to it does not mean anything. This section is the one an examiner will ask about.
Six questions on one sheet: class, main device, hours on a screen on a school day, hours of sleep, whether they use social media, and their percentage in the last examination. Handed out in a form period, filled in and collected on the spot.
There are no names on the form and there never were. Each response has a number, R001 upwards, and that decision came before a single sheet was printed — a form asking about sleep and marks with a name at the top is a form students answer carefully rather than honestly, and it produces data a school should not be holding. Anonymity is not politeness here; it is what makes the answers worth analysing.
Two warnings belong in any report using a survey like this. The screen time and the marks are self-reported, so they are what students say and not what a phone or a mark sheet would show. And a school survey needs the head teacher's permission before it goes out. The file shipped here is a LambdaLab sample of 302 responses standing in for a real one, blanks and all.
4The dataset
One file in, one file out. survey.csv is one row per form, one column per question, which is how the forms are entered — straight down the pile. The blanks in it are real: six students did not answer the sleep question and two left the marks blank, which is what a survey always looks like.
survey.csv — one row per form
| Field | Type | What it holds |
|---|---|---|
response_id | text | R001 upwards. Deliberately not a name. |
class | text | VIII to XII. |
main_device | text | Own smartphone, family smartphone, laptop or tablet. |
screen_hours | decimal | Hours on a screen on a typical school day, as reported. |
sleep_hours | decimal | Hours of sleep on a school night. Blank on six forms. |
uses_social_media | text | Yes or No. |
last_exam_percent | integer | Percentage in the last examination, as reported. Blank on two forms. |
The first few lines of survey.csv
| response_id | class | main_device | screen_hours | sleep_hours | uses_social_media | last_exam_percent |
|---|---|---|---|---|---|---|
R232 | XI | Own smartphone | 3.8 | 8.3 | Yes | 71 |
R212 | XI | Family smartphone | 4.5 | 8.1 | Yes | 74 |
R275 | XII | Own smartphone | 7.1 | 7.7 | Yes | 65 |
R053 | VIII | Own smartphone | 5.7 | 6.1 | Yes | 79 |
R221 | XI | Own smartphone | 2.1 | 9.8 | No | 81 |
R031 | VIII | Own smartphone | 2.8 | 8.5 | No | 85 |
R282 | XII | Own smartphone | 2.9 | 8.5 | Yes | 69 |
R003 | VIII | Own smartphone | 3.4 | 8.7 | Yes | 84 |
Inside survey.csv
Three hundred and two survey responses, with six sleep answers and two marks answers left blank — which is what a real survey looks like. The whole file is 302 rows, 11.6 KB — too much to print here, so this is the head of it. The complete file comes with the download, and you can also take it on its own.
response_id,class,main_device,screen_hours,sleep_hours,uses_social_media,last_exam_percent
R232,XI,Own smartphone,3.8,8.3,Yes,71
R212,XI,Family smartphone,4.5,8.1,Yes,74
R275,XII,Own smartphone,7.1,7.7,Yes,65
R053,VIII,Own smartphone,5.7,6.1,Yes,79
R221,XI,Own smartphone,2.1,9.8,No,81
R031,VIII,Own smartphone,2.8,8.5,No,85
R282,XII,Own smartphone,2.9,8.5,Yes,69
R003,VIII,Own smartphone,3.4,8.7,Yes,845Cleaning the data
Real data arrives with mistakes in it, and this dataset has the ones real data actually has. What was wrong, how much of it there was, and what the program does about each — because how a problem is handled changes the answer, and a report has to say which choice it made.
isnull().sum() prints the whole table of blanks before anything is quoted. A result worked out from 296 forms must not be presented as though 302 students said it.
Only screen_hours — the question the survey is about — costs a form its place. Sleep and marks are dropped where each is needed and nowhere else, so a student who skipped the sleep question still counts in every other figure.
str.strip().str.title(). Two spellings of one answer would have been counted as two different answers.
cut() sorts the hours into four named bands. A scatter of three hundred readings is not something a school assembly can be shown; four bands with an average each is.
6What the program does
- Reads three hundred survey responses from one CSV file
- Prints exactly which questions were left blank and how many, before quoting any figure
- Drops a form only for the question it is missing, not for the whole survey
- Describes the spread of screen time, and counts the students above six hours and below two
- Compares the five classes on average and median screen time
- Correlates screen time with sleep, and reports average sleep in four screen-time bands
- Correlates screen time with the last exam's marks, and prints the minimum and maximum in every band
- Breaks the responses down by device and by social media use
- Writes a class summary out as a CSV for the school
The pandas and pyplot it is built from
| Call | Where | What it is for |
|---|---|---|
pd.read_csv() | step 1 | Loads the survey |
df.isnull().sum() | step 2 | How many forms left each question blank |
df.dropna(subset=[one]) | step 3 | Drops a form only for the question the survey is about |
Series.str.strip().str.title() | step 3 | "yes" and "Yes" become one answer |
Series.describe() | step 4 | The whole spread of screen time in one call |
(series > 6).sum() | step 4 | Counting how many satisfy a condition |
(series > 6).mean() * 100 | step 4 | The same count as a percentage, in one step |
df.groupby(c)[v].agg([...]) | steps 5, 7 | Count, mean and median together |
Series.reindex(order) | step 5 | Classes in school order, not alphabetical |
pd.cut(series, bins=, labels=) | step 6 | Sorts a continuous number into named bands |
df.groupby(bands, observed=True) | step 6 | Grouping by the bands rather than by a column |
Series.corr(other) | step 7 | Screen time against sleep, and against marks |
agg(["count", "mean", "min", "max"]) | step 7 | The min and max are there deliberately, to show the overlap |
Series.value_counts() | step 7 | How many said Yes and how many said No |
plt.axvline() / plt.axhline() | charts 1, 3 | The median line, and the eight-hour sleep line |
7Technical details
| Language | Python 3 |
| Where the data lives | A plain CSV file, read into pandas |
| Libraries |
|
8How it works, step by step
read_csv() loads survey.csv — 302 rows, one per form.
isnull().sum() prints the count for every column. This comes before any result, because how many people answered is part of every figure that follows.
Only a form with no screen_hours is dropped. The Yes/No column is title-cased.
describe() and a few boolean counts give the spread of screen time and the numbers above and below the thresholds.
groupby("class") for the age comparison, groupby on the device column for the ownership one.
cut() sorts screen hours into four named bands, and the sleep and marks figures are averaged inside each band.
corr() twice — screen time against sleep, and screen time against marks — each on its own subset with the blanks for that question removed.
Five charts — a histogram, three bars and a horizontal bar — each saved with savefig().
9Source code
The whole program. Every chart further down this page was drawn by this listing, and every figure quoted came out of running it.
# ---------------------------------------------------------------------------
# survey_analysis.py
#
# Three hundred students in one school answered six questions about their
# phones, their sleep and their marks. This program reads the answers and
# looks for what is actually in them:
#
#   1. How much screen time does a student really have?
#   2. Does it go up with age?
#   3. Do students who are on a screen longer sleep less?
#   4. Is there anything in the file connecting screen time to marks?
#   5. Who has their own phone, and does that change anything?
#
# The survey carries NO names — only a response number. That was decided
# before a single form was handed out, and it is the reason the results can
# be put on a notice board at all.
# ---------------------------------------------------------------------------

import pandas as pd
import matplotlib.pyplot as plt

pd.set_option("display.width", 110)
pd.set_option("display.max_columns", 12)

# --- 1. Read -------------------------------------------------------------
df = pd.read_csv("survey.csv")
print("Forms collected :", len(df))
print("Questions       :", list(df.columns))
print()

# --- 2. Clean ------------------------------------------------------------
# A survey always comes back with questions left blank. Which ones, and how
# many, has to be reported: a result worked out from 294 forms should not be
# presented as though 302 people said it.
print("--- Answers left blank ---")
print(df.isnull().sum())
print()

# "yes" and "Yes" are the same answer typed differently.
df["uses_social_media"] = df["uses_social_media"].str.strip().str.title()

# Screen hours is the question this whole survey is about, so a form without
# it is no use. Sleep and marks are dropped only where each is needed, so one
# blank answer does not throw the rest of that form away.
df = df.dropna(subset=["screen_hours"])
print("Forms used for the main figures:", len(df))
print()

# --- 3. Question 1: how much screen time? --------------------------------
print("--- Screen hours on a school day ---")
print(df["screen_hours"].describe().round(2))
print()
print("Median               :", df["screen_hours"].median(), "hours")
print("More than 6 hours    :", (df["screen_hours"] > 6).sum(), "students",
      "(", round((df["screen_hours"] > 6).mean() * 100, 1), "% )")
print("Less than 2 hours    :", (df["screen_hours"] < 2).sum(), "students")
print()

plt.figure(figsize=(8.5, 4.5))
plt.hist(df["screen_hours"].values, bins=14, color="#3b7dd8", edgecolor="white")
plt.axvline(df["screen_hours"].median(), color="#c0392b", linestyle="--",
            label="Median")
plt.title("Screen time on a school day")
plt.xlabel("Hours")
plt.ylabel("Number of students")
plt.legend()
plt.tight_layout()
plt.savefig("chart1_screen_hours.png")
plt.close()

# --- 4. Question 2: does it grow with age? -------------------------------
order = ["VIII", "IX", "X", "XI", "XII"]
by_class = df.groupby("class")["screen_hours"].agg(["count", "mean", "median"]).round(2)
by_class = by_class.reindex(order)

print("--- Screen time by class ---")
print(by_class)
print()
print("Class VIII to Class XII:", by_class.loc["VIII", "mean"], "->",
      by_class.loc["XII", "mean"], "hours")
print()

plt.figure(figsize=(8, 4.5))
plt.bar(by_class.index, by_class["mean"], color="#4c9f70")
plt.title("Average screen time, class by class")
plt.xlabel("Class")
plt.ylabel("Average hours on a school day")
plt.tight_layout()
plt.savefig("chart2_by_class.png")
plt.close()

# --- 5. Question 3: screen time against sleep ----------------------------
sleep = df.dropna(subset=["sleep_hours"])
print("--- Sleep ---")
print("Forms with the sleep question answered:", len(sleep))
print(sleep["sleep_hours"].describe().round(2))
print()
print("Correlation between screen hours and sleep hours:",
      round(sleep["screen_hours"].corr(sleep["sleep_hours"]), 3))
print()

# cut() sorts a number into named bands, which turns a scatter of readings
# into a table anybody can read.
bands = pd.cut(sleep["screen_hours"],
               bins=[0, 2, 4, 6, 24],
               labels=["Under 2 h", "2 to 4 h", "4 to 6 h", "Over 6 h"])
by_band = sleep.groupby(bands, observed=True)["sleep_hours"].agg(["count", "mean"]).round(2)
print("--- Average sleep, by how long the screen is on ---")
print(by_band)
print()

plt.figure(figsize=(8, 4.5))
plt.bar(by_band.index.astype(str), by_band["mean"], color="#a05fc0")
plt.axhline(8, color="#c0392b", linestyle="--", label="8 hours")
plt.title("Average sleep against screen time")
plt.xlabel("Screen time on a school day")
plt.ylabel("Average sleep (hours)")
plt.legend()
plt.tight_layout()
plt.savefig("chart3_sleep.png")
plt.close()

# --- 6. Question 4: screen time against marks ----------------------------
marks = df.dropna(subset=["last_exam_percent"])
print("--- Marks ---")
print("Forms with the marks question answered:", len(marks))
print("Correlation between screen hours and last exam percentage:",
      round(marks["screen_hours"].corr(marks["last_exam_percent"]), 3))
print()

mband = pd.cut(marks["screen_hours"], bins=[0, 2, 4, 6, 24],
               labels=["Under 2 h", "2 to 4 h", "4 to 6 h", "Over 6 h"])
marks_by_band = marks.groupby(mband, observed=True)["last_exam_percent"].agg(
    ["count", "mean", "min", "max"]).round(1)
print("--- Last exam percentage, by screen time ---")
print(marks_by_band)
print()
print("Note the min and max columns. Every band has students at both ends, so")
print("this is a pattern across the school, not a rule about any one student.")
print()

plt.figure(figsize=(8, 4.5))
plt.bar(marks_by_band.index.astype(str), marks_by_band["mean"], color="#c9772f")
plt.title("Average last-exam percentage, by screen time")
plt.xlabel("Screen time on a school day")
plt.ylabel("Average percentage")
plt.tight_layout()
plt.savefig("chart4_marks.png")
plt.close()

# --- 7. Question 5: whose phone is it? -----------------------------------
device = df.groupby("main_device")["screen_hours"].agg(["count", "mean"]).round(2)
device = device.sort_values("count", ascending=False)
print("--- Main device used ---")
print(device)
print()
social = df["uses_social_media"].value_counts()
print("--- Uses social media ---")
print(social)
print("Share saying yes:", round(social.get("Yes", 0) / social.sum() * 100, 1), "%")
print()

plt.figure(figsize=(8.5, 4.5))
plt.barh(device.index[::-1], device["count"][::-1], color="#2f8fa8")
plt.title("Which device students mainly use")
plt.xlabel("Number of students")
plt.tight_layout()
plt.savefig("chart5_devices.png")
plt.close()

# --- 8. The sheet that goes back to the school ---------------------------
summary = pd.DataFrame({
    "students": by_class["count"],
    "avg_screen_hours": by_class["mean"],
})
summary.to_csv("class_summary.csv")

print("Charts saved : chart1_screen_hours.png .. chart5_devices.png")
print("Summary saved: class_summary.csv")The full report as a PDF, ready to print and fill in. Or the working project as a zip — the program, the dataset, the charts and a README.
10Sample output
A real run, reproduced exactly as it appeared. Nothing below was typed by hand — it is the transcript of the program above against the dataset in section 4.
Forms collected : 302
Questions       : ['response_id', 'class', 'main_device', 'screen_hours', 'sleep_hours', 'uses_social_media', 'last_exam_percent']

--- Answers left blank ---
response_id          0
class                0
main_device          0
screen_hours         0
sleep_hours          6
uses_social_media    0
last_exam_percent    2
dtype: int64

Forms used for the main figures: 302

--- Screen hours on a school day ---
count    302.00
mean       4.47
std        1.81
min        0.40
25%        3.20
50%        4.50
75%        5.80
max        9.70
Name: screen_hours, dtype: float64

Median               : 4.5 hours
More than 6 hours    : 65 students ( 21.5 % )
Less than 2 hours    : 29 students

--- Screen time by class ---
       count  mean  median
class
VIII      57  3.45    3.40
IX        56  4.08    4.15
X         65  4.32    4.10
XI        62  4.96    5.20
XII       62  5.44    5.55

Class VIII to Class XII: 3.45 -> 5.44 hours

--- Sleep ---
Forms with the sleep question answered: 296
count    296.00
mean       7.49
std        1.15
min        4.90
25%        6.70
50%        7.50
75%        8.40
max       10.40
Name: sleep_hours, dtype: float64

Correlation between screen hours and sleep hours: -0.68

--- Average sleep, by how long the screen is on ---
              count  mean
screen_hours
Under 2 h        28  8.72
2 to 4 h         97  8.09
4 to 6 h        107  7.27
Over 6 h         64  6.42

--- Marks ---
Forms with the marks question answered: 300
Correlation between screen hours and last exam percentage: -0.498

--- Last exam percentage, by screen time ---
              count  mean   min   max
screen_hours
Under 2 h        29  86.8  74.0  99.0
2 to 4 h         98  80.4  59.0  99.0
4 to 6 h        108  76.3  53.0  99.0
Over 6 h         65  70.3  53.0  93.0

Note the min and max columns. Every band has students at both ends, so
this is a pattern across the school, not a rule about any one student.

--- Main device used ---
                   count  mean
main_device
Own smartphone       165  5.19
Family smartphone     89  3.50
Laptop / computer     37  3.69
Tablet                11  4.26

--- Uses social media ---
uses_social_media
Yes    212
No      90
Name: count, dtype: int64
Share saying yes: 70.2 %

Charts saved : chart1_screen_hours.png .. chart5_devices.png
Summary saved: class_summary.csv
Running it also wrote class_summary.csv — 5 rows. This is the head of it:
class,students,avg_screen_hours
VIII,57,3.45
IX,56,4.08
X,65,4.32
XI,62,4.96
XII,62,5.4411The charts, and what each one says
CBSE asks for appropriate charts, and the word doing the work in that phrase is appropriate. A line for something that moves in order, a bar to compare things that do not, a histogram for the shape of one column of numbers. Each chart below says which it is, why that kind was chosen, and what it turned out to show.
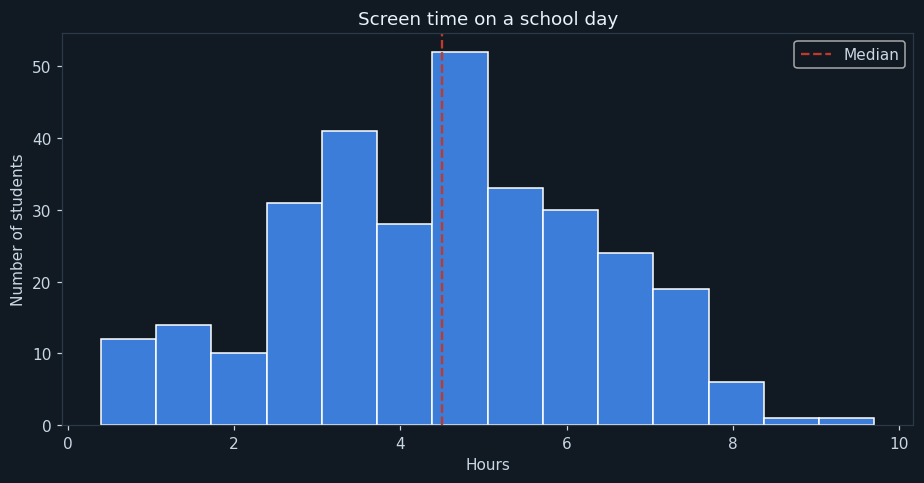
All 302 responses sorted into fourteen bands, with a dashed line at the median. A histogram, because the question is how the school is spread rather than what any one student said.
The median student reports 4.5 hours on a screen on a school day, and the middle half of the school falls between 3.2 and 5.8 hours.
The two ends are worth naming. Sixty-five students — 21.5 per cent — report more than six hours, and twenty-nine report less than two. That is a real range inside one school, and it is the reason a single sentence about "students today" is never going to land: about a fifth of the hall is being described and most of it is not.
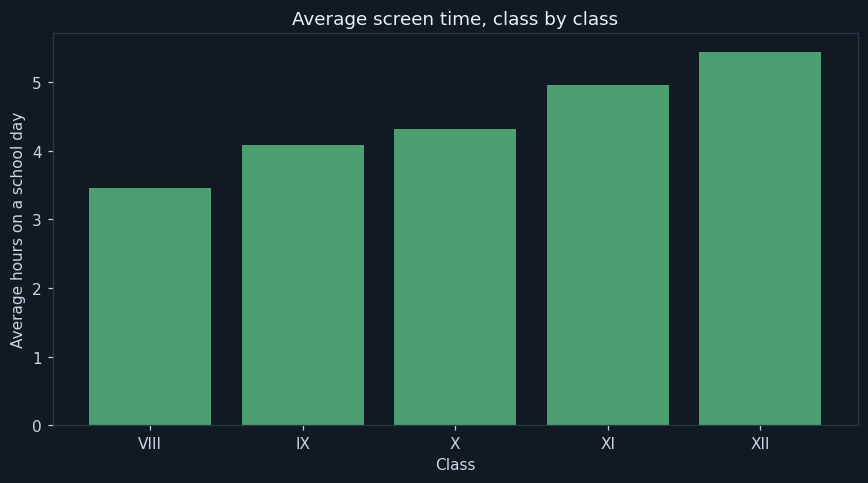
Average screen time for each class from VIII to XII, in school order. That ordering is set deliberately with reindex, because these are Roman numerals and sorting them as text puts IX before VIII.
Yes, and steadily: 3.45 hours in Class VIII rising to 5.44 in Class XII. Every step up the school is a step up in screen time, with no exceptions.
Class XII is the interesting one. It has the most screen time in the school and it is also the year of the board examinations. Whatever the school wants to say about phones, saying it in Class VIII — where the number is lowest and the habit is forming — is likely to be worth more than saying it in Class XII, where it is highest and the year is already under way.
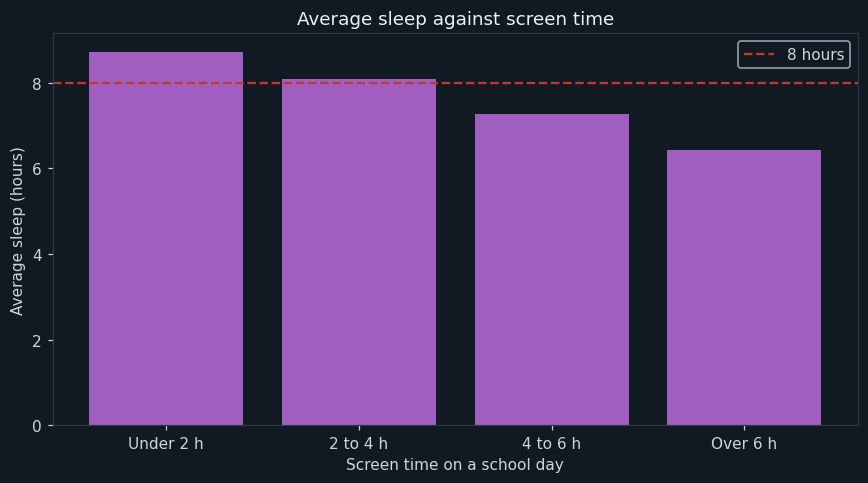
Average hours of sleep in each of four screen-time bands, with a dashed line at eight hours. The bands come from cut(), which turns three hundred individual readings into something a school assembly can be shown.
The four bars fall in a straight line: 8.72 hours of sleep for students under two hours of screen, 8.09 for two to four, 7.27 for four to six, and 6.42 for over six. The correlation is -0.68, which is strong.
The gap between the ends is 2.3 hours of sleep a night. That is the most solid finding in the whole survey, and it is the one to build a talk around — not because it proves the phone causes the lost sleep, but because two and a half hours is large, consistent across every band, and something a student can check against their own week.
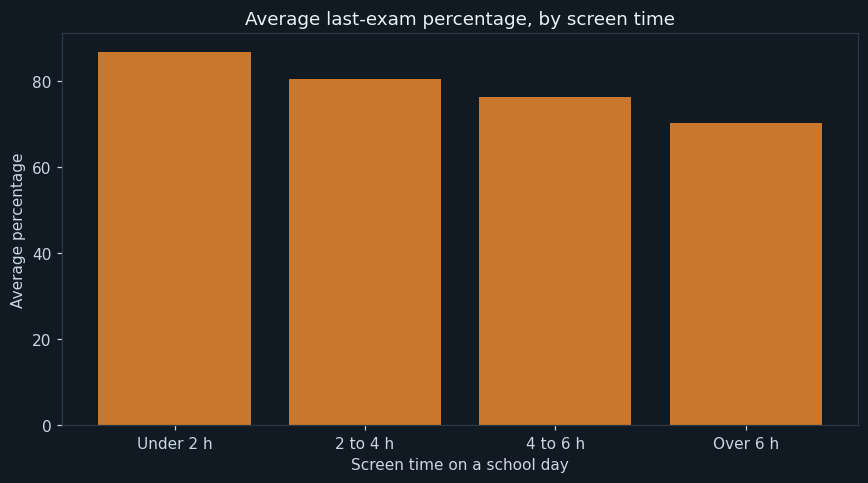
Average last-exam percentage in the same four bands. The chart shows the averages; the table printed beside it shows the minimum and maximum in each band, and that table is the more important half.
The averages fall from 86.8 per cent for students under two hours to 70.3 for those over six — a gap of 16.5 percentage points, at a correlation of -0.498.
Now the part the chart cannot show. In three of the four bands the highest mark is 99, including among students reporting six hours or more; and the lowest mark in the under-two-hours band is 74, while the lowest overall is 53. Every band contains students at both ends. This is a pattern across a school, not a rule about any student, and a survey like this cannot say which way the arrow points — a student who is struggling may well be on their phone more because of it. Saying that out loud is not hedging; it is the difference between a finding and a slogan.
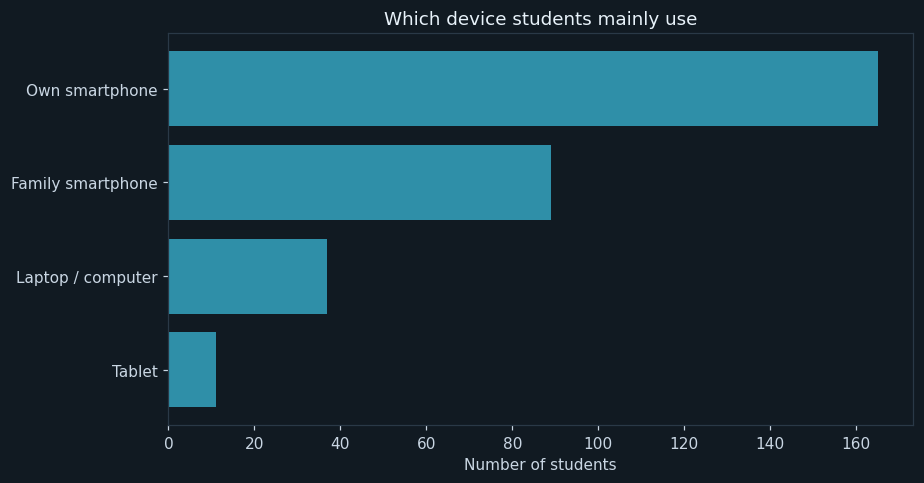
How many students name each device as their main one. Horizontal bars, because the labels are phrases rather than words.
One hundred and sixty-five of 302 students — well over half — have their own smartphone. Eighty-nine mainly use a family phone, thirty-seven a computer and eleven a tablet.
Owning the phone changes the number substantially. Students with their own smartphone average 5.19 hours against 3.50 for those sharing a family one — a difference of about an hour and forty minutes a day. Seventy per cent of the school uses social media. If a school wants one lever, this chart says the age at which a child gets their own phone is a bigger one than any rule made afterwards.
12What the analysis found
- The median student reports 4.5 hours of screen time on a school day; 21.5 per cent report more than six.
- Screen time rises with every class, from 3.45 hours in VIII to 5.44 in XII.
- Sleep falls steadily across the screen-time bands, from 8.72 hours to 6.42 — a gap of 2.3 hours, at a correlation of -0.68.
- Marks fall from an average of 86.8 to 70.3 across the same bands, at a correlation of -0.498.
- Every marks band contains students at both extremes; three of the four contain a 99.
- Students with their own smartphone average 5.19 hours against 3.50 for those sharing one.
- Seventy per cent of the school uses social media, and 55 per cent own their phone.
What should be done about them
This is the part that turns an analysis into a project. A chart that nobody acts on is a picture; a recommendation somebody can argue with is a result.
- Build the school's message around sleep, not marks. It is the stronger relationship and the honest one.
- Say it in Class VIII, where screen time is lowest and the habit is still forming.
- Quote the survey's own numbers. Students dismiss a statistic about children in another country and cannot dismiss one about their own hall.
- State the limits when the findings are presented. A room of sixteen-year-olds will spot an overstated claim immediately, and one overstatement discredits the rest.
- Run the same survey next year with the same questions, so the school has a trend and not a snapshot.
- Do not put names on the form. The answers are only worth having because it is anonymous.
13Testing
Every case below was actually executed and its result recorded as it appeared — including the ones expected to fail. Each one builds a small dataset of its own and runs the whole program against it.
| Test case | Expected | Actual | Result |
|---|---|---|---|
| The full survey, 302 forms | Forms collected : 302 | Forms collected : 302 | Pass |
| All 302 count towards the main figures | Forms used for the main figures: 302 | Forms used for the main figures: 302 | Pass |
| The six blank sleep answers are reported | sleep_hours 6 | sleep_hours 6 | Pass |
| Screen time against sleep, across the whole school | Correlation between screen hours and sleep hours: -0.68 | Correlation between screen hours and sleep hours: -0.68 | Pass |
| A form with no sleep answer still counts for screen time | Forms used for the main figures: 2 | Forms used for the main figures: 2 | Pass |
| ...and is the only one missing from the sleep figures | Forms with the sleep question answered: 1 | Forms with the sleep question answered: 1 | Pass |
| ...and still counts for marks | Forms with the marks question answered: 2 | Forms with the marks question answered: 2 | Pass |
| A form with no screen time is dropped from everything | Forms used for the main figures: 1 | Forms used for the main figures: 1 | Pass |
| Exactly 4 hours falls in the 2-to-4 band | 2 to 4 h 1 8.0 | 2 to 4 h 1 8.0 | Pass |
| ...and 4.1 hours falls in the next one up | 4 to 6 h 1 6.0 | 4 to 6 h 1 6.0 | Pass |
| A student on exactly 6 hours is not counted as more than 6 | More than 6 hours : 1 students ( 50.0 % ) | More than 6 hours : 1 students ( 50.0 % ) | Pass |
| Two spellings of Yes are counted together | Yes 2 | Yes 2 | Pass |
| survey.csv missing altogether | FileNotFoundError: [Errno 2] No such file or directory: 'survey.csv' | FileNotFoundError: [Errno 2] No such file or directory: 'survey.csv' | Pass |
Two kinds of case are in there on purpose. The boundary cases test the edge of a rule, where a program is most often wrong by one. The failure cases check that it stops cleanly and says why, instead of quietly producing a wrong answer.
14Advantages
Set against the ways the job is done today:
- The school gets evidence about its own students instead of a statistic about somebody else's
- Every form is examined, including the ones that contradict what the school expected
- The blanks are counted and reported, so no figure is quoted from more forms than answered it
- A form missing one answer still counts in every other figure
- The minimum and maximum are printed beside every average, which is what keeps the marks finding honest
- Nothing in the file identifies a student
15Limitations and future scope
What this version cannot tell you
A data project should be honest about the limits of its own data. Each of these is a reason for one of the additions below:
- Everything is self-reported. Students estimate their screen time and their marks, and both estimates may be wrong in the same direction.
- One school and one year, so nothing here describes students in general
- It cannot show cause. Screen time and sleep move together; which produces which is not in the file, and may run both ways.
- Screen time is one number for the whole day, so homework on a laptop and hours on a game look identical
- Weekends are not asked about, and they may be where most of the difference is
- Three hundred students is enough to see a pattern this size and not enough to see a small one
What to add next
This is also where you make the project yours. Take one or two of these, or something nobody here thought of:
- Ask separately about study screen time and entertainment screen time, which this survey cannot tell apart
- Ask about weekends as well as school days
- Run it again next year and compare, which is the only way to see whether anything the school did worked
- Add a question about bedtime phone use, which is the most likely mechanism behind the sleep finding
- Compare the marks against the school's actual records rather than self-report, with permission and with the responses still anonymous
- Ask what students would want changed, so the report ends with their answer and not only the school's
16What you may have to teach yourself
CBSE expects some self-learning in a project and says so. For this one, that means:
- cut(), which turns a continuous number into named bands. It is the single most useful function in this project for making a result presentable.
- What a correlation of -0.68 means and what it does not. This project is a good place to learn the difference between correlation and cause, because here it actually matters.
- Why dropping a row for one missing answer would be wrong, and how to drop per question instead
- How to run a survey properly: anonymous, permission first, same questions for everybody, and the blanks reported
17Conclusion
The program does what it set out to do. Three hundred forms come back as five charts and a class summary, and a school that had opinions about phones now has figures about its own students.
The strongest finding is about sleep. Students reporting over six hours of screen time sleep 6.42 hours a night against 8.72 for those reporting under two — a gap of two and a third hours, falling steadily across every band, at a correlation of -0.68. That is large enough to matter and consistent enough to trust, and it is the finding worth building a school's message on.
The finding about marks is the one that had to be handled carefully, and handling it carefully is most of what this project taught. The averages do fall — 86.8 per cent down to 70.3 — and every band still contains students at both ends, with a 99 among the heaviest screen users. The survey cannot say which way the arrow points, and a student who is struggling may well be on their phone more because of it rather than the other way round. It would have been easy to write a sentence here that a school could put on a poster. The data does not support that sentence, and saying so is the difference between a report and a slogan.
18References
Every report needs a bibliography, and a data project needs its data source at the top of it.
- A survey of 302 students of one school, conducted anonymously with the head teacher's permission. The dataset shipped here is a LambdaLab sample standing in for it.
- CBSE Informatics Practices, Class XII, Unit 4: Societal Impacts — digital footprint, data privacy and the health concerns of technology use
- pandas user guide, on cut() and binning — https://pandas.pydata.org/docs/reference/api/pandas.cut.html
- pandas user guide, “Working with missing data” — https://pandas.pydata.org/docs/user_guide/missing_data.html
- Informatics Practices, Class XII — the NCERT / CBSE prescribed textbook, for the chapters on data handling with pandas and data visualisation
- pandas documentation — https://pandas.pydata.org/docs/
- Matplotlib documentation — https://matplotlib.org/stable/
- CBSE Senior School Curriculum, Informatics Practices (Subject Code 065) — the project guidelines this report follows
- LambdaLab — https://www.lambdalab.in