Your Toolkit: Matplotlib
To create visualizations in Python we need a special tool. The most popular and fundamental one for the job is the Matplotlib library.
1Matplotlib and PyPlot
The Workshop and the Workbench
Matplotlib is a complete artist's workshop. It contains everything you could possibly need to create a huge variety of static, animated and interactive plots.
Inside that workshop there is one specific workbench called PyPlot. It provides the collection of essential functions — plot(), title(), show() — that make it simple to build a 2D plot step by step. For most of your work, you will be using PyPlot.
So matplotlib is the library, and matplotlib.pyplot is the module inside it that you actually call functions from.
2Getting started: setting up your environment
Step 1: Installation. Matplotlib does not come with Python — you install it with pip, Python's package installer. Open your terminal or command prompt and type:
pip install matplotlibStep 2: Importing PyPlot. Once installed, import the pyplot module into your script. You can import it directly, but the standard and highly recommended practice is to give it a shorter nickname, or alias.
# The recommended way to import pyplot
import matplotlib.pyplot as pltimport matplotlib.pyplot as banana is perfectly legal Python, and banana.plot() would work fine. But plt is a universal convention. Every book, every tutorial and every exam paper uses it, so anyone reading your code knows instantly what plt means. Stick with plt.3The story so far…
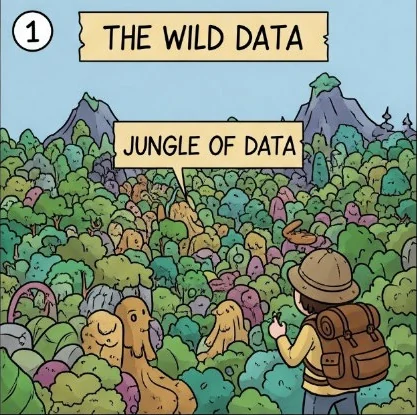
The Wild Data
You're lost in a jungle of raw numbers. Rows and rows of them. No patterns, no story — just noise.
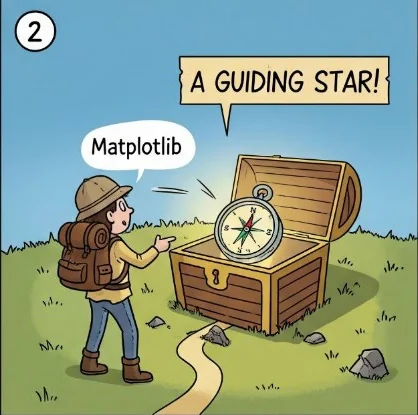
A Guiding Star!
You find a treasure chest. Inside is Matplotlib — a complete artist's workshop for drawing data.

The Secret Map Key
One line of code unlocks the whole workshop — and gives it the short name everyone uses.
import matplotlib.pyplot as plt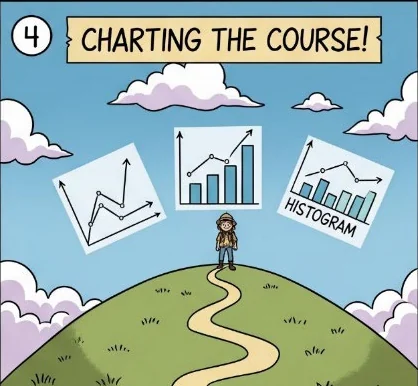
Charting the Course!
Lines, bars, histograms — the same numbers, now a map you can actually read.
4Overview of plotting capabilities
Matplotlib can produce nearly any 2D plot imaginable — including scatter plots, pie charts, box plots and stem plots — and even complex 3D surface plots. But mastering the basics is by far the most important first step.
The three foundational charts below cover a remarkable range of real data analysis tasks, and they are the ones your curriculum focuses on.
| Chart | Function | What it shows | Classic example |
|---|---|---|---|
| Line Chart | plt.plot() | A trend or progress over time | Stock prices over a month |
| Bar Chart | plt.bar() | A comparison of distinct categories | Population of different cities |
| Histogram | plt.hist() | The distribution of one numeric variable | Spread of student test scores |
5Which chart should I use?
Picking the wrong chart type is the most common mistake beginners make, and no amount of styling can rescue it. Work through these scenarios until the choice feels automatic.
Scenario 1 of 5. Which of the three core charts fits best?
6Your very first plot
Enough theory. The code below is a complete matplotlib program — import, plot, show. Press Run and it will execute right here in your browser. Try changing the numbers and running it again.
What is the standard, conventional alias for matplotlib.pyplot?
You want to compare the number of medals won by 5 different countries. Which chart?