Will Tomorrow's Air Be Poor?
Today's pollution and tomorrow's wind forecast in; a one-day warning out — the perceptron from Unit 2, finding its own weights.
1Introduction
In winter, many Indian cities have days when the air is officially Poor or worse. A school usually finds out that morning, when the children are already on the field.
The monitoring station records the air every day, and the weather office forecasts tomorrow's wind. Calm, still days trap pollution; windy days clear it. The information to see a bad day coming is already there.
This project builds a perceptron — the single artificial neuron of Unit 2 — that reads today's readings and tomorrow's wind forecast and decides whether to warn that tomorrow will be Poor.
Sustainable Cities and Communities
Good Health and Well-being
SDG 11 includes reducing the harm cities do to the air people breathe, and SDG 3 aims to cut illness from air pollution. Fine dust (PM2.5) is worst for children, older people and people with asthma. A warning one day ahead gives schools and families time to plan — moving sports indoors, keeping medicines ready.
The curriculum asks that the project be related to the Sustainable Development Goals. That link is the reason the problem is worth solving, so it belongs at the very start of the report, not tacked on at the end.
2Stage 1 — Problem Scoping
Problem scoping means understanding the problem properly before building anything. The tool for it is the 4Ws Problem Canvas: who has the problem, what the problem is, where it happens, and why solving it matters.
- Schools and parents, especially of children with asthma
- The city's pollution control office
- Poor-air days are known only on the day, too late to plan
- Children play outdoors on days that harm their lungs
- A city with an air-quality monitoring station
- Mostly in October to January, when the air is worst
- A day's warning lets people protect themselves
- Outdoor activities can be moved to cleaner days
The problem statement
The four answers are then joined into one sentence, using the curriculum's problem statement template:
School principals deciding on outdoor activities, parents of children with asthma, and a city's pollution control office.
How it is done today
Accurate, but it tells you about today. By the time you hear it, the day's plans are made.
Some large cities do have forecasts made by scientists using weather and pollution models. Many towns do not, and the forecasts are not always reported where schools see them.
The simplest forecast of all, and surprisingly good, because pollution changes slowly. Any model has to beat it to be worth having, so this project uses it as the baseline.
Objectives
- To read two years of daily air-quality readings from a CSV file
- To make the label — will tomorrow be Poor? — from the next day's reading, and handle days when the sensor was offline
- To explore how pollution changes through the year and what clears it
- To train a perceptron on one year and let it learn its own weights
- To test it on the next year, against the simple guess "tomorrow will be like today"
- To issue a warning for new days from today's readings
📘 Revise: Stage 1 — Problem Scoping
3Stage 2 — Data Acquisition
Each row is one day at the monitoring station: PM2.5 (fine dust, in micrograms per cubic metre), wind speed, humidity and temperature, plus the weather office's forecast of tomorrow's wind.
The file has 731 rows, from 2024-01-01 to 2025-12-31.
Real data of exactly this kind is public. The Central Pollution Control Board publishes daily readings for stations across India, and the India Meteorological Department publishes weather forecasts. For your own project, download a year or two for your nearest station — and say so in your report.
Features and label
The features are what the model is given. The label is the answer it has to learn to give.
| Column | Type | What it holds | Role |
|---|---|---|---|
pm25 | decimal | Fine dust today, micrograms per cubic metre | feature |
wind_forecast_kmph | decimal | The weather office's forecast of tomorrow's wind, km/h | feature |
humidity_pct | integer | Humidity today, % | feature |
temp_c | decimal | Temperature today, °C | feature |
poor_tomorrow | 1 or 0 | Made by the program: 1 if tomorrow's PM2.5 is above 90 (Poor or worse) — the label | label |
date | date | The day of the reading | not used |
wind_kmph | decimal | Today's wind speed — shown for comparison, not used | not used |
The first eight rows of air_quality.csv
| date | pm25 | wind_kmph | wind_forecast_kmph | humidity_pct | temp_c |
|---|---|---|---|---|---|
2024-01-01 | 159.0 | 3.3 | 12.3 | 55.0 | 16.3 |
2024-01-02 | 96.0 | 11.2 | 10.0 | 57.0 | 18.9 |
2024-01-03 | 106.0 | 8.5 | 17.5 | 75.0 | 18.6 |
2024-01-04 | 68.0 | 13.3 | 11.1 | 68.0 | 15.1 |
2024-01-05 | 80.0 | 9.8 | 13.7 | 46.0 | 15.5 |
2024-01-06 | 71.0 | 10.8 | 13.8 | 61.0 | 15.1 |
2024-01-07 | 35.0 | 12.7 | 12.6 | 59.0 | 17.2 |
2024-01-08 | 25.0 | 13.3 | 4.6 | 59.0 | 16.0 |
Inside air_quality.csv
Two years of daily readings from one station. On a few days the sensor was offline and PM2.5 is blank. The whole file is 731 rows, 24.9 KB. It comes with the project download, and you can take the file on its own.
📘 Revise: Stage 2 — Data Acquisition
4Stage 3 — Data Exploration
Data exploration means getting to know the data before trusting it: fixing what is wrong with it, then drawing it to see the patterns. The charts here are what decide what the model should be.
What was wrong with the data
The file has no label column. The program makes one by giving each day the next day's PM2.5 with shift(-1), then marking it 1 if that is above 90 — the start of Poor on India's air quality scale. This is done before anything is removed, so that each day is paired with its real tomorrow.
A day is removed if its own reading is missing, or if tomorrow's is (then its label is unknown). So one blank reading removes two days: that day, and the day before it. The very last day has no tomorrow at all, so it goes too.
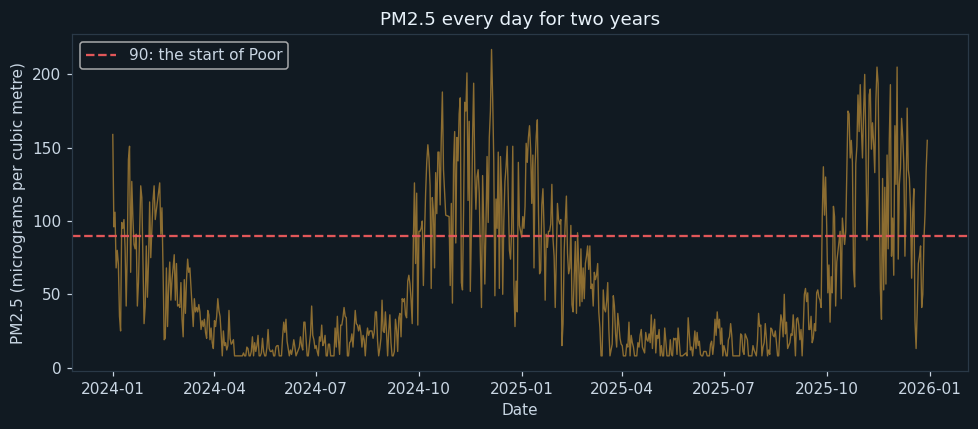
Each point is one day. The red dashed line is 90, where Poor begins. A line chart suits data that runs in time order.
The pattern is the same both years. The air is cleanest in the monsoon, when rain and wind wash it, and worst from October to January. Poor days come in runs, not one at a time — a bad day is usually followed by another. That is why "tomorrow will be like today" is a hard baseline to beat.
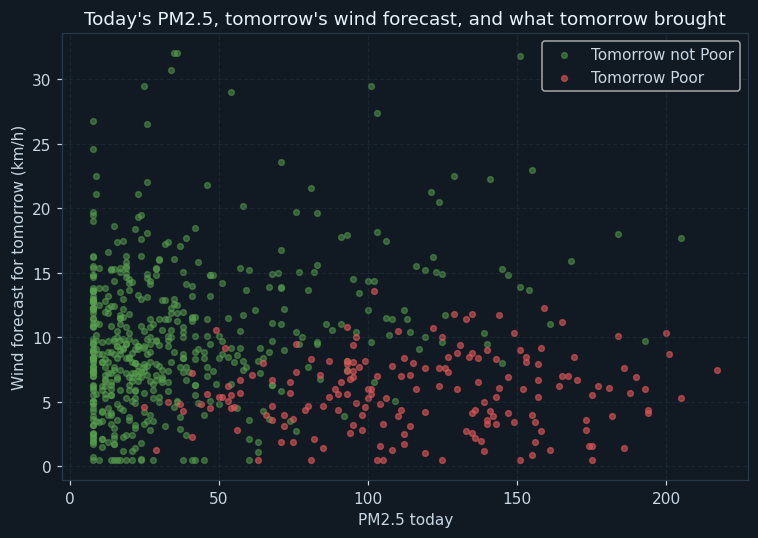
Each dot is one day: today's PM2.5 across, the wind forecast for tomorrow up. Red means tomorrow turned out Poor.
The red dots sit to the right and low down: high pollution today and little wind expected tomorrow. A windy forecast clears the air even after a bad day — the dots on the right but high up are mostly green. So today's PM2.5 alone is not enough; the wind forecast tells the model when a bad run is about to end.
📘 Revise: Stage 3 — Data Exploration
5Stage 4 — Modelling
Where this model sits in the family of AI models:
The answer is yes or no — will tomorrow be Poor? — so it is classification. The training days come with what tomorrow really brought, so it is supervised learning. The model is a perceptron, the building block of the neural networks in Unit 2.
How the model works
For a forecast, the data must not be shuffled before splitting. The perceptron is trained on 2024 (361 days) and tested on 2025 (360 days). That is exactly how it would be used — learning from the past and judged on a future it has never seen.
A perceptron multiplies each input by a weight, adds them up, adds a bias, and answers "Poor tomorrow" if the total is above 0. In Unit 2 the weights were given. Here it starts with every weight at 0 and learns them. It goes through the training days one at a time. When it gets a day right, nothing changes. When it gets one wrong, each weight is nudged a little in the direction that would have given the right answer. It goes through all the training days 30 times.
One detail turned out to matter. In date order, every pass ends with December's long run of Poor days, and that streak pulled all the weights towards "always Poor". So the days are visited in a shuffled order on each pass. That does not break the forecast: the shuffling happens inside 2024 only, and 2025 is still unseen.
📘 Revise: Stage 4 — Modelling
6Stage 5 — Evaluation
Both forecasts were judged on all of 2025. The perceptron's accuracy was 89.4 %; copying today gave 85.6 %.
For a health warning, the worst mistake is a missed Poor day: children playing outside on a day that harms them. That is a false negative, so recall matters most. The perceptron's recall was 79.3 % against 71.7 % for the baseline.
The baseline was worth including. Copying today is right most of the time because pollution comes in runs, and a model that could not beat it would not be worth using. Beating it shows the perceptron has learned something real — when a run of bad days is about to begin or end.
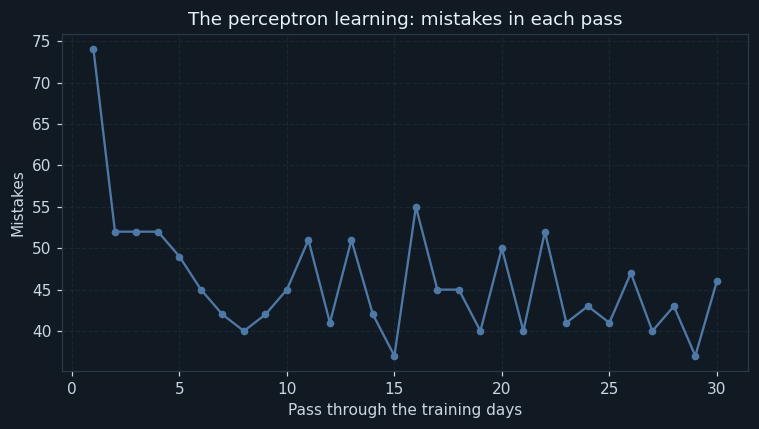
Across: each pass through the training days. Up: how many days the perceptron got wrong during that pass.
It started at 74 mistakes and ended at 46. The line is bumpy rather than smooth, because a perceptron changes its weights after every single mistake, and no straight-line rule can get every day right. It goes down overall — the perceptron is learning.
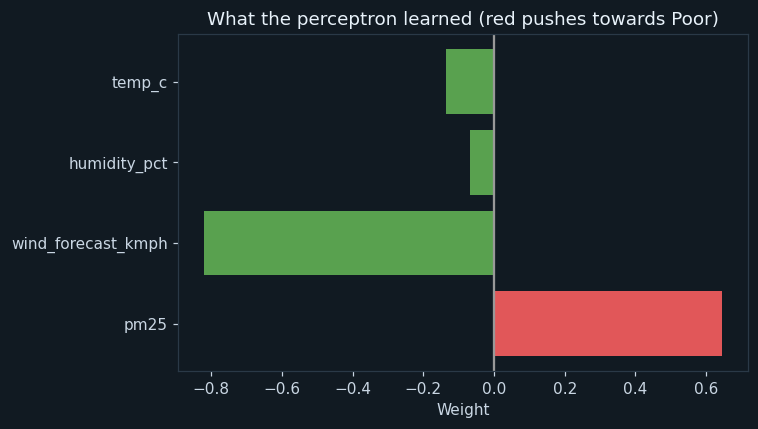
One bar for each input: the weight the perceptron found for it. Red bars (positive) push the answer towards Poor; green bars (negative) push it away.
The perceptron found the two facts that matter, with nobody telling it. Today's PM2.5 has a strong positive weight: a bad day tends to be followed by another. The wind forecast has a strong negative weight: wind clears the air. Humidity and temperature have small weights, so they matter much less.
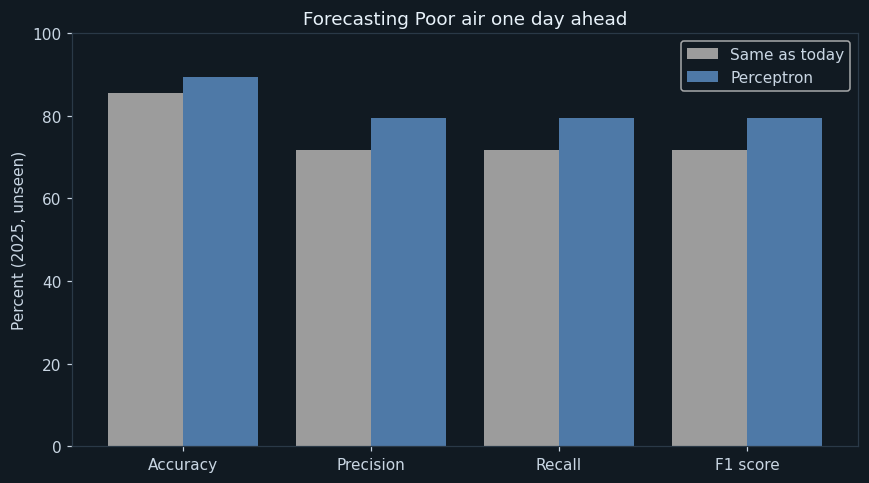
Four pairs of bars, measured on 2025 — a year neither forecast had seen.
The perceptron is ahead on every measure: accuracy 89.4 % against 85.6 %, and recall 79.3 % against 71.7 %. The gain comes from the days when a bad run ends or begins — exactly where copying today goes wrong, and exactly where the wind forecast helps.
📘 Revise: The Confusion Matrix
7Stage 6 — Deployment
The program takes three new days and issues an alert or not for each. Notice the second one: very high PM2.5 today, but a windy forecast — and the perceptron does not raise an alert, because it has learned that wind clears the air.
In real use the program would run every evening when the day's readings and the next day's forecast are in, and send a message to schools: "Poor air likely tomorrow — plan indoor activities."
📘 Revise: Stage 6 — Deployment
8Ethical concerns
An AI project is not finished when the model works. The curriculum asks three questions of every model — is it fair (bias), can it explain itself (transparency), and who answers for its mistakes (accountability). For this project:
A false alarm moves a sports period indoors. A missed warning puts children with asthma outside on a Poor day. A real system should lean towards warning, and the report should say how often it misses.
The perceptron has four weights and a bias, and each one can be read and explained. A school can see why it raised an alert — which makes it easier to trust and to question.
The model learned one station in one city. A city by the sea, or in the hills, has different weather and pollution. It must be retrained with that place's data before it is used there.
📘 Revise: Bias, Transparency, Accountability
9Source code
The whole program — it is also in the downloads at the top of this page — in Python with pandas, NumPy and matplotlib — the three libraries of Unit 7. It is laid out as the six stages of the AI Project Cycle, one after another. Every chart on this page was drawn by it, and every number came out of running it.
# ---------------------------------------------------------------------------
# air_quality_alert.py
#
# AI project on Statistical Data: warning a day ahead when the air is going
# to be "Poor" or worse, from today's readings at a city monitoring station.
#
# CBSE Class X, Artificial Intelligence (417), Part C project work.
# SDG 11 (Sustainable Cities) and SDG 3 (Good Health and Well-being).
#
# The model is a PERCEPTRON - the single artificial neuron of Unit 2. It
# multiplies each input by a weight, adds a bias, and says "Poor tomorrow"
# if the total is above 0. In Unit 2 the weights were given. Here the
# perceptron finds them itself: every time it gets a training day wrong, it
# nudges its weights a little towards the right answer, and it goes through
# the training days again and again.
#
# Libraries: pandas (the data), numpy (the arithmetic), matplotlib (charts).
# ---------------------------------------------------------------------------

# %% Stage 1 - Problem scoping
print("=" * 60)
print("WILL TOMORROW'S AIR BE POOR?")
print("=" * 60)
print("Who   : schools, parents, and people with asthma")
print("What  : bad-air days are announced on the day, too late to plan")
print("Where : a city with one air-quality monitoring station")
print("Why   : a day's warning lets people protect themselves")
print()

# %% Stage 2 - Data acquisition
import pandas as pd
import numpy as np
import matplotlib.pyplot as plt

pd.set_option("display.width", 120)
pd.set_option("display.max_columns", 20)

data = pd.read_csv("air_quality.csv", parse_dates=["date"])

print("--- Stage 2: Data acquisition ---")
print("Rows read    :", len(data))
print("First day    :", data["date"].min().date())
print("Last day     :", data["date"].max().date())
print()
print("The first 10 rows:")
print(data.head(10))
print()

# %% Stage 3 - Data exploration
print("--- Stage 3: Data exploration ---")

# PM2.5 above 90 is "Poor" or worse on India's air quality scale.
# The label is about TOMORROW, so each day is given the next day's PM2.5.
# This must be done BEFORE any rows are removed, or a gap in the data would
# pair a day with the wrong "tomorrow".
data["pm25_tomorrow"] = data["pm25"].shift(-1)
data["poor_tomorrow"] = np.where(data["pm25_tomorrow"] > 90, 1, 0)

# A day is unusable if today's or tomorrow's reading is missing (the
# sensor was offline). The last day has no tomorrow at all.
unusable = data["pm25"].isnull() | data["pm25_tomorrow"].isnull()
print("Days with a missing reading today or tomorrow :", unusable.sum(), "(removed)")
data = data[~unusable]
print("Days left                                     :", len(data))
print()

print("PM2.5 - mean   :", round(np.mean(data["pm25"]), 1))
print("PM2.5 - median :", np.median(data["pm25"]))
print("Days followed by a Poor day :", data["poor_tomorrow"].sum(), "of", len(data))
print()

monthly = data.groupby(data["date"].dt.month)["pm25"].mean().round(1)
print("Average PM2.5 in each month (both years together):")
print(monthly.to_string())
print()

# Chart 1: PM2.5 every day for two years.
plt.figure(figsize=(9, 4))
plt.plot(data["date"], data["pm25"], color="#8c6d31", linewidth=0.9)
plt.axhline(90, color="#e15759", linestyle="--", label="90: the start of Poor")
plt.title("PM2.5 every day for two years")
plt.xlabel("Date")
plt.ylabel("PM2.5 (micrograms per cubic metre)")
plt.legend()
plt.tight_layout()
plt.savefig("chart1_pm25_daily.png")
plt.close()

# Chart 2: today's PM2.5 and tomorrow's wind forecast.
poor = data[data["poor_tomorrow"] == 1]
fine = data[data["poor_tomorrow"] == 0]
plt.figure(figsize=(7, 5))
plt.scatter(fine["pm25"], fine["wind_forecast_kmph"], color="#59a14f", alpha=0.5, s=14, label="Tomorrow not Poor")
plt.scatter(poor["pm25"], poor["wind_forecast_kmph"], color="#e15759", alpha=0.6, s=14, label="Tomorrow Poor")
plt.title("Today's PM2.5, tomorrow's wind forecast, and what tomorrow brought")
plt.xlabel("PM2.5 today")
plt.ylabel("Wind forecast for tomorrow (km/h)")
plt.legend()
plt.grid(True, linestyle="--", alpha=0.4)
plt.tight_layout()
plt.savefig("chart2_today_tomorrow.png")
plt.close()

# %% Stage 4 - Modelling
print("--- Stage 4: Modelling ---")
# Today's PM2.5, humidity and temperature, plus the weather office's
# FORECAST of tomorrow's wind - real air-quality forecasts use weather
# forecasts too, because wind is what clears the air.
features = ["pm25", "wind_forecast_kmph", "humidity_pct", "temp_c"]

# For a forecast the rows must NOT be shuffled. The model learns from the
# first year and is tested on the second - exactly how it would be used:
# trained on the past, judged on a future it has not seen.
train = data[data["date"].dt.year == 2024]
test = data[data["date"].dt.year == 2025]
print("Training days (2024) :", len(train))
print("Testing days (2025)  :", len(test))
print()

low = train[features].min()
high = train[features].max()
X_train = ((train[features] - low) / (high - low)).values
X_test = ((test[features] - low) / (high - low)).values
y_train = train["poor_tomorrow"].values
y_test = test["poor_tomorrow"].values

# The perceptron starts knowing nothing: every weight and the bias are 0.
weights = np.zeros(len(features))
bias = 0.0
rate = 0.1          # how big each nudge is
passes = 30         # how many times it goes through the training days

# The days are visited in a shuffled order on every pass. In date order,
# every pass would end on December's long run of Poor days, and that last
# streak would drag all the weights towards "always Poor".
shuffle = np.random.default_rng(1)

mistakes_each_pass = []
for p in range(passes):
    mistakes = 0
    for i in shuffle.permutation(len(X_train)):
        total = np.dot(X_train[i], weights) + bias
        if total > 0:
            output = 1
        else:
            output = 0
        error = y_train[i] - output          # +1, 0 or -1
        if error != 0:
            # Wrong: move every weight a little towards the right answer.
            weights = weights + rate * error * X_train[i]
            bias = bias + rate * error
            mistakes = mistakes + 1
    mistakes_each_pass.append(mistakes)

print("Mistakes in the first pass :", mistakes_each_pass[0])
print("Mistakes in the last pass  :", mistakes_each_pass[-1])
print()
print("Weights the perceptron learned:")
for i in range(len(features)):
    print("  " + features[i].ljust(20), round(weights[i], 3))
print("  " + "bias".ljust(20), round(bias, 3))
print()

# Chart 3: the perceptron learning.
plt.figure(figsize=(7, 4))
plt.plot(range(1, passes + 1), mistakes_each_pass, marker="o", color="#4e79a7", markersize=4)
plt.title("The perceptron learning: mistakes in each pass")
plt.xlabel("Pass through the training days")
plt.ylabel("Mistakes")
plt.grid(True, linestyle="--", alpha=0.4)
plt.tight_layout()
plt.savefig("chart3_learning.png")
plt.close()

# Chart 4: the weights it learned.
plt.figure(figsize=(7, 4))
colours = []
for w in weights:
    if w > 0:
        colours.append("#e15759")
    else:
        colours.append("#59a14f")
plt.barh(features, weights, color=colours)
plt.axvline(0, color="#999999")
plt.title("What the perceptron learned (red pushes towards Poor)")
plt.xlabel("Weight")
plt.tight_layout()
plt.savefig("chart4_weights.png")
plt.close()

# %% Stage 5 - Evaluation
print("--- Stage 5: Evaluation ---")
perceptron = []
for i in range(len(X_test)):
    if np.dot(X_test[i], weights) + bias > 0:
        perceptron.append(1)
    else:
        perceptron.append(0)

# A simple baseline to beat: "tomorrow will be like today".
same_as_today = []
for v in test["pm25"]:
    if v > 90:
        same_as_today.append(1)
    else:
        same_as_today.append(0)

results = []
for name, predicted in [["Same as today", same_as_today], ["Perceptron", perceptron]]:
    tp = fn = fp = tn = 0
    for i in range(len(y_test)):
        if y_test[i] == 1 and predicted[i] == 1:
            tp = tp + 1
        elif y_test[i] == 1:
            fn = fn + 1
        elif predicted[i] == 1:
            fp = fp + 1
        else:
            tn = tn + 1
    accuracy = (tp + tn) / len(y_test) * 100
    precision = 0
    if tp + fp > 0:
        precision = tp / (tp + fp) * 100
    recall = 0
    if tp + fn > 0:
        recall = tp / (tp + fn) * 100
    f1 = 0
    if precision + recall > 0:
        f1 = 2 * precision * recall / (precision + recall)
    results.append([name, accuracy, precision, recall, f1])
    print(name)
    print("  " + name + " TP, FN, FP, TN :", tp, fn, fp, tn)
    print("  " + name + " accuracy  :", round(accuracy, 1), "%")
    print("  " + name + " precision :", round(precision, 1), "%")
    print("  " + name + " recall    :", round(recall, 1), "%")
    print("  " + name + " F1 score  :", round(f1, 1), "%")
    print()

# Chart 5: perceptron against the baseline.
x = np.arange(4)
plt.figure(figsize=(8, 4.5))
plt.bar(x - 0.2, results[0][1:5], width=0.4, label="Same as today", color="#9c9c9c")
plt.bar(x + 0.2, results[1][1:5], width=0.4, label="Perceptron", color="#4e79a7")
plt.xticks(x, ["Accuracy", "Precision", "Recall", "F1 score"])
plt.ylim(0, 100)
plt.ylabel("Percent (2025, unseen)")
plt.title("Forecasting Poor air one day ahead")
plt.legend()
plt.tight_layout()
plt.savefig("chart5_compared.png")
plt.close()

# %% Stage 6 - Deployment
print("--- Stage 6: Deployment ---")
today = pd.DataFrame({
    "pm25":               [78, 120, 85],
    "wind_forecast_kmph": [3.0, 18.0, 9.0],
    "humidity_pct": [72, 45, 60],
    "temp_c":       [15.0, 24.0, 19.0],
})
scaled = ((today - low) / (high - low)).values
for i in range(len(today)):
    total = np.dot(scaled[i], weights) + bias
    if total > 0:
        alert = "ALERT: Poor air likely tomorrow - plan indoor activities"
    else:
        alert = "No alert"
    t = today.iloc[i]
    print("PM2.5", int(t["pm25"]), " wind forecast", t["wind_forecast_kmph"], "km/h  humidity", int(t["humidity_pct"]),
          "%  ->", alert)
The library calls it is built from
| Call | Where | What it does |
|---|---|---|
pd.read_csv(..., parse_dates=) | Stage 2 | Reads the file and turns the date column into real dates |
shift(-1) | Stage 3 | Gives each day the next day's reading, to make the label |
np.where(... > 90, 1, 0) | Stage 3 | Marks a day 1 if tomorrow is Poor |
groupby(date.dt.month).mean() | Stage 3 | Average PM2.5 in each month |
data[data["date"].dt.year == 2024] | Stage 4 | Splits by year — train on the past, test on the future |
np.dot(x, weights) + bias | Stage 4 | The perceptron's weighted sum |
weights + rate * error * x | Stage 4 | The nudge that teaches the perceptron after a mistake |
permutation() | Stage 4 | Visits the training days in a shuffled order on each pass |
plt.plot / plt.scatter / plt.barh / plt.bar | Stages 3–5 | The charts |
10Sample output
A real run, exactly as it appeared. Nothing below was typed by hand.
============================================================
WILL TOMORROW'S AIR BE POOR?
============================================================
Who   : schools, parents, and people with asthma
What  : bad-air days are announced on the day, too late to plan
Where : a city with one air-quality monitoring station
Why   : a day's warning lets people protect themselves

--- Stage 2: Data acquisition ---
Rows read    : 731
First day    : 2024-01-01
Last day     : 2025-12-31

The first 10 rows:
        date   pm25  wind_kmph  wind_forecast_kmph  humidity_pct  temp_c
0 2024-01-01  159.0        3.3                12.3          55.0    16.3
1 2024-01-02   96.0       11.2                10.0          57.0    18.9
2 2024-01-03  106.0        8.5                17.5          75.0    18.6
3 2024-01-04   68.0       13.3                11.1          68.0    15.1
4 2024-01-05   80.0        9.8                13.7          46.0    15.5
5 2024-01-06   71.0       10.8                13.8          61.0    15.1
6 2024-01-07   35.0       12.7                12.6          59.0    17.2
7 2024-01-08   25.0       13.3                 4.6          59.0    16.0
8 2024-01-09   99.0        3.7                 8.2          56.0    17.5
9 2024-01-10   95.0       10.2                 8.1          48.0    12.3

--- Stage 3: Data exploration ---
Days with a missing reading today or tomorrow : 10 (removed)
Days left                                     : 721

PM2.5 - mean   : 56.6
PM2.5 - median : 36.0
Days followed by a Poor day : 182 of 721

Average PM2.5 in each month (both years together):
date
1      96.6
2      71.2
3      39.5
4      17.6
5      13.5
6      17.2
7      16.0
8      22.8
9      42.8
10    108.3
11    128.5
12    108.9

--- Stage 4: Modelling ---
Training days (2024) : 361
Testing days (2025)  : 360

Mistakes in the first pass : 74
Mistakes in the last pass  : 46

Weights the perceptron learned:
  pm25                 0.645
  wind_forecast_kmph   -0.82
  humidity_pct         -0.068
  temp_c               -0.136
  bias                 0.0

--- Stage 5: Evaluation ---
Same as today
  Same as today TP, FN, FP, TN : 66 26 26 242
  Same as today accuracy  : 85.6 %
  Same as today precision : 71.7 %
  Same as today recall    : 71.7 %
  Same as today F1 score  : 71.7 %

Perceptron
  Perceptron TP, FN, FP, TN : 73 19 19 249
  Perceptron accuracy  : 89.4 %
  Perceptron precision : 79.3 %
  Perceptron recall    : 79.3 %
  Perceptron F1 score  : 79.3 %

--- Stage 6: Deployment ---
PM2.5 78  wind forecast 3.0 km/h  humidity 72 %  -> ALERT: Poor air likely tomorrow - plan indoor activities
PM2.5 120  wind forecast 18.0 km/h  humidity 45 %  -> No alert
PM2.5 85 wind forecast 9.0 km/h humidity 60 % -> No alert11The same project without code
Orange's Neural Network widget is built from many perceptrons; with a single small hidden layer it does the same job. Logistic Regression is also a weighted sum with a bias, and is a good comparison. The tool is Orange Data Mining.
Load air_quality.csv (after adding the poor_tomorrow column in a spreadsheet, or with Python).
Use pm25, wind_forecast_kmph, humidity_pct and temp_c as features and poor_tomorrow as the target.
Split by date: rows from 2024 for training, rows from 2025 for testing. Do not use random sampling for a forecast.
Train on the 2024 rows.
Choose Test on test data and give it the 2025 rows. Set the target class to 1 and read the recall.
Plot pm25 against date to see the seasons, as in chart 1.
📘 Revise: No-Code AI, and Orange
12Testing
Every case below was actually run, and the result is what came back. Each one gives the whole program a small input of its own.
| Test case | Expected | Actual | Result |
|---|---|---|---|
| Two full years | Rows read : 731 | Rows read : 731 | Pass |
| Sensor-offline days, and the day before each, are removed | Days with a missing reading today or tomorrow : 10 (removed) | Days with a missing reading today or tomorrow : 10 (removed) | Pass |
| Trained on 2024 only, never shuffled into 2025 | Testing days (2025) : 360 | Testing days (2025) : 360 | Pass |
| The perceptron makes fewer mistakes by its last pass | Mistakes in the last pass : 46 | Mistakes in the last pass : 46 | Pass |
| It beats "tomorrow will be like today" | Perceptron accuracy : 89.4 % | Perceptron accuracy : 89.4 % | Pass |
| Air that flips every day: copying today is always wrong | Same as today accuracy : 0.0 % | Same as today accuracy : 0.0 % | Pass |
| ...but the perceptron learns to read the wind forecast | Perceptron accuracy : 100.0 % | Perceptron accuracy : 100.0 % | Pass |
| One blank reading removes that day and the day before it (whose tomorrow is blank), plus the very last day | Days with a missing reading today or tomorrow : 3 (removed) | Days with a missing reading today or tomorrow : 3 (removed) | Pass |
| The data file is missing | FileNotFoundError: [Errno 2] No such file or directory: 'air_quality.csv' | FileNotFoundError: [Errno 2] No such file or directory: 'air_quality.csv' | Pass |
13Results, limits and what next
- Pollution follows the seasons: cleanest in the monsoon, worst from October to January.
- Poor days come in runs, so "tomorrow will be like today" is right 85.6 % of the time.
- The perceptron learned, by itself, that high PM2.5 today pushes towards Poor and wind tomorrow pushes away.
- Trained on 2024 and tested on 2025, it reached an accuracy of 89.4 % and a recall of 79.3 %, beating the baseline.
- Visiting the training days in date order stopped it learning; shuffling within the training year fixed it.
What this model cannot do
- One station; pollution can differ across a city
- Only one day ahead
- A perceptron draws one straight dividing line; it cannot learn more complicated patterns
- It does not know about events such as festivals or crop-stubble burning
What to add next
This is where you make the project your own. Take one of these, or an idea of yours:
- Use real data for your city from the Central Pollution Control Board
- Add a feature for the season of crop-stubble burning, or for festivals
- Forecast two or three days ahead
- Try Orange's Neural Network widget, which joins many perceptrons together
What you may have to learn on your own
- How a perceptron learns its weights by correcting its mistakes
- Why a time-based forecast must be tested on later data, not on a random split
- Why a simple baseline is worth having
- India's air quality bands, and what PM2.5 is
14Conclusion
The project shows that a single artificial neuron can learn a useful air-quality warning. Starting from zero, it found that today's pollution and tomorrow's wind forecast are what matter, and on a year it had never seen it beat the honest baseline of copying today.
Two things went wrong on the way, and both were useful. Visiting the days in date order stopped the perceptron learning, because every pass ended on a long streak of bad days. And without a wind forecast, nothing could beat copying today — because what clears the air tomorrow is tomorrow's wind.
The idea links straight back to Unit 2. There, a perceptron's weights were given and the sum was worked out by hand. Here the same sum is used, and the computer finds the weights itself — which is what learning means.
15Questions for the viva
The project carries a viva voce of its own, worth 5 marks. These are the questions it is most likely to ask about this project. Try answering each one aloud before opening it.
▸What does a perceptron do?
It multiplies each input by a weight, adds them up, adds a bias, and gives output 1 if the total is above 0, otherwise 0.
▸How did your perceptron learn its weights?
It started with every weight at 0. Each time it got a training day wrong, it nudged each weight a little towards the right answer. It went through the training days 30 times.
▸Why did you not shuffle the data before splitting it?
Because it is a forecast. The model must be trained on the past (2024) and tested on a future it has not seen (2025), the way it would really be used.
▸What is your baseline, and why use one?
"Tomorrow will be like today." Pollution changes slowly, so it is quite good. A model that cannot beat it is not worth using.
▸What did the weights tell you?
Today's PM2.5 has a strong positive weight and tomorrow's wind forecast a strong negative one. High pollution tends to continue, and wind clears it.
▸Which matters more here, precision or recall? Why?
Recall, because a missed Poor day means children outdoors in harmful air, which is worse than a false alarm.
▸Which SDGs does it relate to?
SDG 11, Sustainable Cities and Communities, and SDG 3, Good Health and Well-being.
16References
- Central Pollution Control Board, National Air Quality Index — https://cpcb.nic.in/
- India Meteorological Department — https://mausam.imd.gov.in/
- Rosenblatt, F. (1958). The perceptron: a probabilistic model for information storage and organization in the brain. Psychological Review, 65(6).
- Orange Data Mining, Neural Network widget — https://orangedatamining.com/widget-catalog/model/neuralnetwork/
- CBSE, Artificial Intelligence (Subject Code 417), Class X curriculum, 2026-27 — Part C, Practical and Project Work
- CBSE, Artificial Intelligence Facilitator Handbook, Class X
- pandas — https://pandas.pydata.org/docs/; NumPy — https://numpy.org/doc/; Matplotlib — https://matplotlib.org/stable/
- LambdaLab — https://www.lambdalab.in