Who Needs a Helping Hand?
Spotting the students who may need extra help early in the year — a rule the computer learns for itself, set against the attendance rule everyone assumes, and the ethics of letting a model label children.
1Introduction
Every year some students fail the final exam who could have passed with a little extra help. The trouble is timing: by the time a teacher is sure who is struggling, there is no time left.
Schools often use a simple rule of thumb to decide who to worry about — low attendance. But is attendance really the best early warning? Or is something else a better sign?
This project lets the computer test every simple rule it can make from the school's records and find the one that would have worked best. Because it is about children, it also asks carefully how such a model should and should not be used.
Quality Education
Reduced Inequalities
SDG 4 asks that every child completes school with real learning, not only the ones who find it easy. Students who fall behind are often the ones with the least help at home. Finding them early, so extra classes reach them before the exam, is a direct way to reduce that gap — SDG 10.
The curriculum asks that the project be related to the Sustainable Development Goals. That link is the reason the problem is worth solving, so it belongs at the very start of the report, not tacked on at the end.
2Stage 1 — Problem Scoping
Problem scoping means understanding the problem properly before building anything. The tool for it is the 4Ws Problem Canvas: who has the problem, what the problem is, where it happens, and why solving it matters.
- Students who are falling behind
- Class teachers and the academic coordinator
- Struggling students are often noticed only after the exam
- Remedial classes have limited places
- A secondary school
- In the first months of the school year, after the first unit tests
- Help that comes early can change the result
- Places in remedial classes go to the students who need them
The problem statement
The four answers are then joined into one sentence, using the curriculum's problem statement template:
Class teachers and the school's academic coordinator, deciding who should be invited to remedial classes after the first unit tests.
How it is done today
Flag any student below 75% attendance. It is simple and familiar, but it assumes that students who come to school are doing fine. This project tests that assumption.
Teachers often know. But one teacher sees a class for a few periods a week, and a quiet student who is lost can go unnoticed.
Clear evidence, but it arrives halfway through the year, when much of the time to help has gone.
Objectives
- To read the records of 360 students from a CSV file, using roll numbers only
- To remove records with missing marks or impossible attendance
- To explore which records differ most between students who needed support and those who did not
- To let the computer find the single best rule from the training data
- To compare it with the attendance rule, using recall, precision and the F1 score
- To set out the ethical rules any such system in a school must follow
📘 Revise: Stage 1 — Problem Scoping
3Stage 2 — Data Acquisition
Each row is one student's record from the first months of the year: attendance, the share of homework handed in, the average of the unit tests, and hours of self-study a week from a short survey. The label says whether the student later scored below 40% in the final exam.
The file has 360 rows. Students are known only by roll number — there are no names anywhere.
Real student records are private and protected. A student must never collect classmates' marks for a project. A real version could only be built by the school itself, with permission, and with the data kept by the school. For your own project, use made-up data like this, or anonymous survey data that you have permission to collect.
Features and label
The features are what the model is given. The label is the answer it has to learn to give.
| Column | Type | What it holds | Role |
|---|---|---|---|
attendance_pct | integer | Attendance so far, as a percentage | feature |
homework_pct | integer | Share of homework handed in, as a percentage | feature |
unit_test_avg | decimal | Average of the unit tests so far, as a percentage | feature |
study_hours_week | integer | Hours of self-study a week (from a survey) | feature |
needs_support | Yes / No | Whether the student later scored below 40% in the final exam — the label | label |
roll_no | text | Roll number — never a name | not used |
The first eight rows of student_records.csv
| roll_no | attendance_pct | homework_pct | unit_test_avg | study_hours_week | needs_support |
|---|---|---|---|---|---|
9001 | 85 | 42 | 49.1 | 2 | No |
9002 | 87 | 53 | 45.0 | 1 | No |
9003 | 83 | 44 | 46.1 | 4 | Yes |
9004 | 78 | 75 | 60.4 | 6 | No |
9005 | 67 | 56 | 57.9 | 5 | No |
9006 | 90 | 100 | 58.7 | 6 | No |
9007 | 88 | 73 | 72.1 | 9 | No |
9008 | 96 | 58 | 72.2 | 9 | No |
Inside student_records.csv
Records of 360 students, by roll number. A few unit-test averages are blank, and two attendance figures are over 100%. The whole file is 360 rows, 7.6 KB. It comes with the project download, and you can take the file on its own.
📘 Revise: Stage 2 — Data Acquisition
4Stage 3 — Data Exploration
Data exploration means getting to know the data before trusting it: fixing what is wrong with it, then drawing it to see the patterns. The charts here are what decide what the model should be.
What was wrong with the data
These students missed the tests or the marks were not entered. Their rows are removed and counted; inventing a mark would be wrong.
A percentage cannot go above 100, so 910 and 108 are typing mistakes. The rows are removed. Exactly 100% is kept — it is possible.
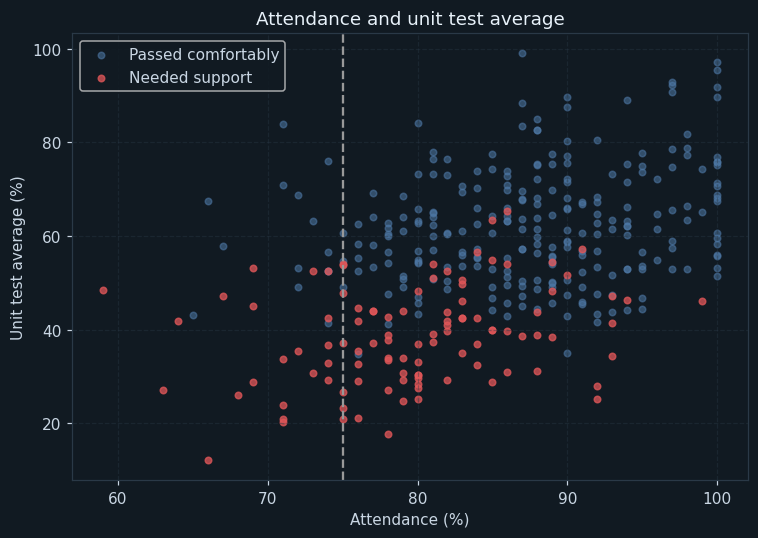
Each dot is one student: attendance across, unit-test average up. Red dots needed support in the end. The dashed line is 75% attendance.
Look where the red dots are. Most of them are to the right of the dashed line — these students came to school regularly. What they share is that they are low down: their unit-test averages are low. Attendance alone would miss them.
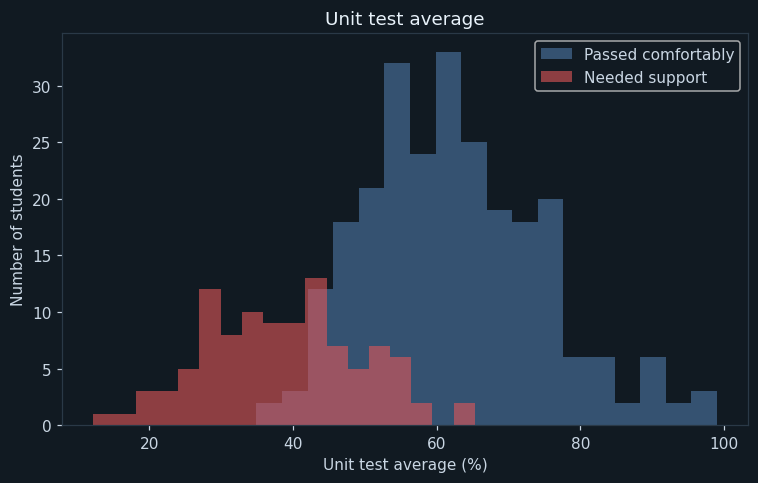
Two histograms on top of each other, one for each group of students.
The two groups separate well on unit-test average, with only a small overlap around 40 to 50%. This chart suggests the unit tests are the best early warning — but the computer has not been asked yet.
📘 Revise: Stage 3 — Data Exploration
5Stage 4 — Modelling
Where this model sits in the family of AI models:
The answer is Yes or No — will this student need support? — so it is classification. The training records come with what really happened in the exam, so it is supervised learning.
How the model works
The records are split into 284 for training and 71 for testing.
The teacher's rule is written by a person: flag the student if attendance is below 75%.
The learned rule is found by the computer. It has the form "flag the student if this feature is below this cut-off". The program tries every feature and every value as the cut-off — 349 rules in all — counts the mistakes each would make on the training students, and keeps the one with the fewest. That is learning in its simplest form: the rule comes from the data, not from a person.
A rule with one question like this is the first branch of a decision tree, and is called a decision stump. Orange's Tree widget grows the full tree by asking the same kind of question again and again.
📘 Revise: Stage 4 — Modelling
6Stage 5 — Evaluation
Both rules were tested on the same 71 students that neither had seen.
The key question is which mistake is worse. A false negative is a student who needed help and did not get it: they may fail. A false positive is a student invited to a few extra classes they did not strictly need. Missing a student is worse, so recall matters most here.
On recall the two rules are far apart: 10.5 % for the attendance rule against 68.4 % for the learned rule. The learned rule's precision is also high, at 92.9 %, so the places in remedial classes would mostly go to the right students.
The most useful result is not the model at all. It is the evidence that the familiar rule of thumb does not work: in this data, most struggling students come to school regularly. A school relying on attendance alone would be looking in the wrong place.
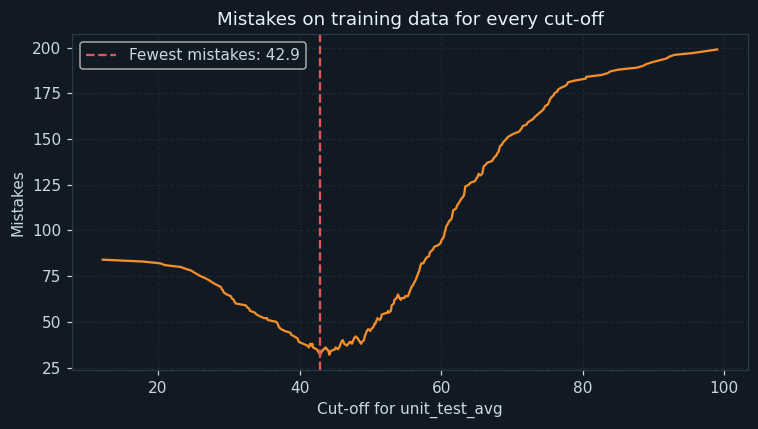
Across: every possible cut-off for the feature the computer picked. Up: how many training students that rule would have got wrong.
The line falls to a lowest point and rises again. Too low a cut-off misses struggling students; too high flags students who were fine. The computer simply picked the bottom of the curve — flag if unit_test_avg < 42.9.
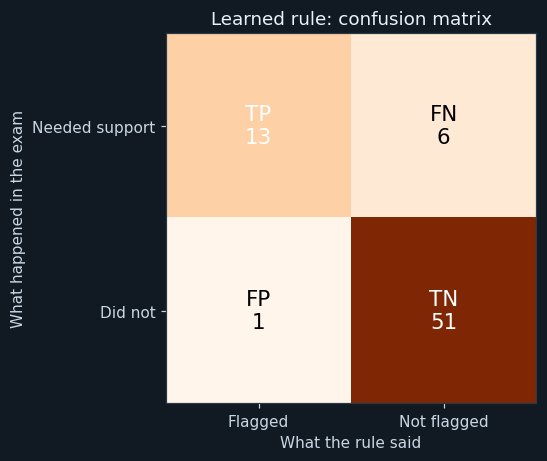
TP: flagged and did need support. FN: needed support but was not flagged. FP: flagged but did not need support. TN: not flagged, did not need support.
On the testing students the learned rule's numbers are 13 6 1 51 (TP, FN, FP, TN). It flagged only one student who did not need help, and caught most of those who did.
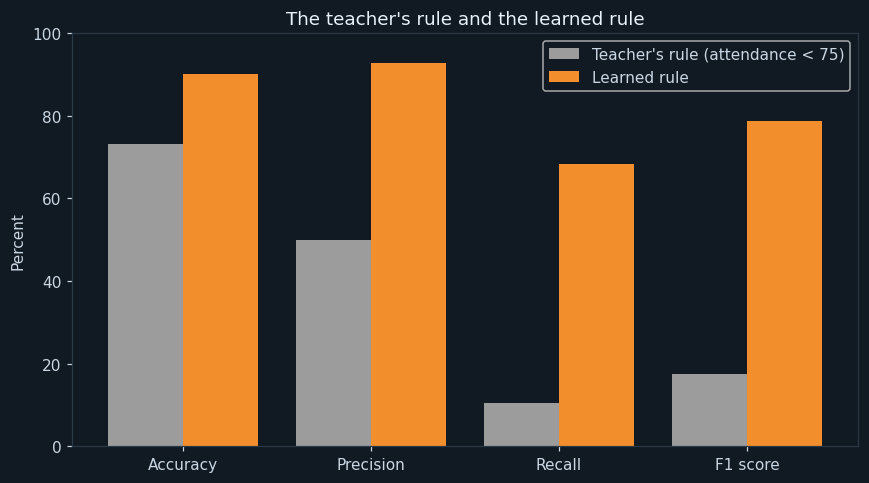
Four pairs of bars — accuracy, precision, recall and F1 — for each rule.
The attendance rule has an accuracy of 73.2 %, which sounds fine. Its recall is 10.5 %: it would have missed almost every student who needed help. Its accuracy looks good only because most students do not need support, and a rule that flags almost nobody is right about them.
The learned rule's recall is 68.4 % and its accuracy 90.1 %. It is better on every measure.
📘 Revise: The Confusion Matrix
7Stage 6 — Deployment
After the first unit tests, the program checks three students and suggests whether each should be offered extra classes. It ends with a reminder printed in the output itself: the model only suggests.
In real use, the coordinator would get a short list of suggested students. Each class teacher would look at the list, add or remove names from what they know, talk to each student, and offer support privately — never as a public list.
📘 Revise: Stage 6 — Deployment
8Ethical concerns
An AI project is not finished when the model works. The curriculum asks three questions of every model — is it fair (bias), can it explain itself (transparency), and who answers for its mistakes (accountability). For this project:
Being marked as "needs support" can embarrass a student or lower a teacher's expectations of them. The list must stay private, be used only to offer help, and never follow the student around. It is a suggestion for this term, not a judgement about the student.
If a student is missed, a person must answer for it — not the program. That is why the class teacher makes every final decision and can add students the rule did not flag.
If the data comes from one school, the rule fits that school. A cut-off learned from one school's unit tests means little in another school with harder or easier tests. It must be retrained, and checked, wherever it is used.
Marks and attendance are personal. Real records must stay with the school, use roll numbers only, and be used only for the purpose they were collected for.
This model is one sentence long: flag if unit-test average is below 42.9. A teacher, a parent or the student can read it and question it. For decisions about children, a model that can explain itself is far better than one that cannot.
📘 Revise: Bias, Transparency, Accountability
9Source code
The whole program — it is also in the downloads at the top of this page — in Python with pandas, NumPy and matplotlib — the three libraries of Unit 7. It is laid out as the six stages of the AI Project Cycle, one after another. Every chart on this page was drawn by it, and every number came out of running it.
# ---------------------------------------------------------------------------
# student_support.py
#
# AI project on Statistical Data: spotting, early in the year, the students
# who may need extra help to pass - so that help reaches them in time.
#
# CBSE Class X, Artificial Intelligence (417), Part C project work.
# SDG 4 (Quality Education) and SDG 10 (Reduced Inequalities).
#
# Two models are compared:
#   - the TEACHER'S RULE, written by a person: flag a student whose
#     attendance is below 75%
#   - a LEARNED RULE: the computer tries every feature and every cut-off
#     on the training data, and keeps the one rule that makes the fewest
#     mistakes. (This is a decision tree with a single question, which is
#     called a decision stump.)
#
# Libraries: pandas (the data), numpy (the arithmetic), matplotlib (charts).
# ---------------------------------------------------------------------------

# %% Stage 1 - Problem scoping
print("=" * 60)
print("WHO NEEDS A HELPING HAND?")
print("=" * 60)
print("Who   : class teachers, and students who are falling behind")
print("What  : struggling students are often noticed only after the exam")
print("Where : a school, in the first months of the year")
print("Why   : help given early can change the result")
print()

# %% Stage 2 - Data acquisition
import pandas as pd
import numpy as np
import matplotlib.pyplot as plt

pd.set_option("display.width", 120)
pd.set_option("display.max_columns", 20)

data = pd.read_csv("student_records.csv")

print("--- Stage 2: Data acquisition ---")
print("Rows read    :", len(data))
print("Columns read :", len(data.columns))
print()
print("The first 10 rows:")
print(data.head(10))
print()

# %% Stage 3 - Data exploration
print("--- Stage 3: Data exploration ---")
features = ["attendance_pct", "homework_pct", "unit_test_avg", "study_hours_week"]
label = "needs_support"

missing = data["unit_test_avg"].isnull().sum()
data = data.dropna(subset=["unit_test_avg"])
print("Rows with no unit test average   :", missing, "(removed)")

# Attendance is a percentage, so anything above 100 is a typing mistake.
wrong = (data["attendance_pct"] > 100).sum()
data = data[data["attendance_pct"] <= 100]
print("Rows with attendance above 100%  :", wrong, "(removed)")
print("Rows left                        :", len(data))
print()

print("Students who needed support and who did not:")
print(data[label].value_counts())
print()
print("Average of each feature in the two groups:")
print(data.groupby(label)[features].mean().round(1))
print()

yes = data[data[label] == "Yes"]
no = data[data[label] == "No"]

# Chart 1: attendance against unit test average.
plt.figure(figsize=(7, 5))
plt.scatter(no["attendance_pct"], no["unit_test_avg"], color="#4e79a7", alpha=0.55, s=18, label="Passed comfortably")
plt.scatter(yes["attendance_pct"], yes["unit_test_avg"], color="#e15759", alpha=0.75, s=18, label="Needed support")
plt.axvline(75, color="#999999", linestyle="--")
plt.title("Attendance and unit test average")
plt.xlabel("Attendance (%)")
plt.ylabel("Unit test average (%)")
plt.legend()
plt.grid(True, linestyle="--", alpha=0.4)
plt.tight_layout()
plt.savefig("chart1_attendance_tests.png")
plt.close()

# Chart 2: unit test average in the two groups.
plt.figure(figsize=(7, 4.5))
plt.hist(no["unit_test_avg"], bins=18, alpha=0.6, color="#4e79a7", label="Passed comfortably")
plt.hist(yes["unit_test_avg"], bins=18, alpha=0.6, color="#e15759", label="Needed support")
plt.title("Unit test average")
plt.xlabel("Unit test average (%)")
plt.ylabel("Number of students")
plt.legend()
plt.tight_layout()
plt.savefig("chart2_unit_tests.png")
plt.close()

# %% Stage 4 - Modelling
print("--- Stage 4: Modelling ---")

data = data.sample(frac=1, random_state=2)
cut = int(len(data) * 0.8)
train = data[:cut]
test = data[cut:]
print("Training rows :", len(train))
print("Testing rows  :", len(test))
print()

# The learned rule: "flag the student if <feature> is below <cut-off>".
# Try every feature, and every value it takes in the training data as the
# cut-off. Count the mistakes each rule makes on the training students, and
# keep the rule with the fewest.
truth = train[label] == "Yes"
best_mistakes = len(train) + 1
rules_tried = 0
for f in features:
    for cutoff in sorted(train[f].unique()):
        rules_tried = rules_tried + 1
        flagged = train[f] < cutoff
        mistakes = (flagged != truth).sum()
        if mistakes < best_mistakes:
            best_mistakes = mistakes
            best_feature = f
            best_cutoff = cutoff

print("Rules tried                :", rules_tried)
print("Learned rule               : flag if", best_feature, "<", best_cutoff)
print("Mistakes on training data  :", best_mistakes, "of", len(train))
print("Teacher's rule             : flag if attendance_pct < 75")
print()

# For the chart: mistakes made by every cut-off of the chosen feature.
cutoffs = sorted(train[best_feature].unique())
cutoff_mistakes = []
for cutoff in cutoffs:
    cutoff_mistakes.append(((train[best_feature] < cutoff) != truth).sum())

# Chart 3: how the computer chose its cut-off.
plt.figure(figsize=(7, 4))
plt.plot(cutoffs, cutoff_mistakes, color="#f28e2b")
plt.axvline(best_cutoff, color="#e15759", linestyle="--", label="Fewest mistakes: " + str(best_cutoff))
plt.title("Mistakes on training data for every cut-off")
plt.xlabel("Cut-off for " + best_feature)
plt.ylabel("Mistakes")
plt.legend()
plt.grid(True, linestyle="--", alpha=0.4)
plt.tight_layout()
plt.savefig("chart3_choosing_cutoff.png")
plt.close()

teacher = []
learned = []
for i in range(len(test)):
    row = test.iloc[i]
    if row["attendance_pct"] < 75:
        teacher.append("Yes")
    else:
        teacher.append("No")
    if row[best_feature] < best_cutoff:
        learned.append("Yes")
    else:
        learned.append("No")

# %% Stage 5 - Evaluation
print("--- Stage 5: Evaluation ---")
actual = list(test[label])

results = []
for name, predicted in [["Teacher's rule", teacher], ["Learned rule", learned]]:
    tp = fn = fp = tn = 0
    for i in range(len(actual)):
        if actual[i] == "Yes" and predicted[i] == "Yes":
            tp = tp + 1
        elif actual[i] == "Yes":
            fn = fn + 1
        elif predicted[i] == "Yes":
            fp = fp + 1
        else:
            tn = tn + 1
    accuracy = (tp + tn) / len(actual) * 100
    precision = 0
    if tp + fp > 0:
        precision = tp / (tp + fp) * 100
    recall = 0
    if tp + fn > 0:
        recall = tp / (tp + fn) * 100
    f1 = 0
    if precision + recall > 0:
        f1 = 2 * precision * recall / (precision + recall)
    results.append([name, tp, fn, fp, tn, accuracy, precision, recall, f1])
    print(name)
    print("  " + name + " TP, FN, FP, TN :", tp, fn, fp, tn)
    print("  " + name + " accuracy  :", round(accuracy, 1), "%")
    print("  " + name + " precision :", round(precision, 1), "%")
    print("  " + name + " recall    :", round(recall, 1), "%")
    print("  " + name + " F1 score  :", round(f1, 1), "%")
    print()

# Chart 4: confusion matrix of the learned rule.
r = results[1]
grid = [[r[1], r[2]], [r[3], r[4]]]
plt.figure(figsize=(5, 4.3))
plt.imshow(grid, cmap="Oranges")
names = [["TP", "FN"], ["FP", "TN"]]
for row in range(2):
    for col in range(2):
        if grid[row][col] > max(max(grid)) / 2:
            ink = "white"
        else:
            ink = "black"
        plt.text(col, row, names[row][col] + "\n" + str(grid[row][col]),
                 ha="center", va="center", fontsize=14, color=ink)
plt.xticks([0, 1], ["Flagged", "Not flagged"])
plt.yticks([0, 1], ["Needed support", "Did not"])
plt.xlabel("What the rule said")
plt.ylabel("What happened in the exam")
plt.title("Learned rule: confusion matrix")
plt.tight_layout()
plt.savefig("chart4_matrix.png")
plt.close()

# Chart 5: the two rules side by side.
x = np.arange(4)
plt.figure(figsize=(8, 4.5))
plt.bar(x - 0.2, results[0][5:9], width=0.4, label="Teacher's rule (attendance < 75)", color="#9c9c9c")
plt.bar(x + 0.2, results[1][5:9], width=0.4, label="Learned rule", color="#f28e2b")
plt.xticks(x, ["Accuracy", "Precision", "Recall", "F1 score"])
plt.ylim(0, 100)
plt.ylabel("Percent")
plt.title("The teacher's rule and the learned rule")
plt.legend()
plt.tight_layout()
plt.savefig("chart5_rules_compared.png")
plt.close()

# %% Stage 6 - Deployment
print("--- Stage 6: Deployment ---")
print("Three students after the first unit tests:")
students = pd.DataFrame({
    "roll_no":          ["9401", "9402", "9403"],
    "attendance_pct":   [92, 70, 88],
    "homework_pct":     [55, 85, 90],
    "unit_test_avg":    [36.5, 64.0, 71.5],
    "study_hours_week": [3, 7, 8],
})
for i in range(len(students)):
    s = students.iloc[i]
    if s[best_feature] < best_cutoff:
        advice = "suggest to the class teacher for extra classes"
    else:
        advice = "no flag"
    print("Roll", s["roll_no"], ": attendance", s["attendance_pct"], "%, unit tests",
          s["unit_test_avg"], "% ->", advice)
print("(The model only suggests. The class teacher decides, and talks to the student first.)")
The library calls it is built from
| Call | Where | What it does |
|---|---|---|
pd.read_csv() | Stage 2 | Reads the CSV file |
dropna() / data[... <= 100] | Stage 3 | Removes blank marks and impossible attendance |
groupby(label).mean() | Stage 3 | Average of each feature in the two groups |
plt.scatter / plt.hist | Stage 3 | The scatter plot and the two histograms |
sorted(train[f].unique()) | Stage 4 | Every value a feature takes — each is tried as a cut-off |
(flagged != truth).sum() | Stage 4 | Counts the mistakes one rule makes |
nested for loops | Stage 4 | Try every feature, and every cut-off for it |
TP, FN, FP, TN counts | Stage 5 | The confusion matrix, counted with a loop |
plt.plot / plt.imshow / plt.bar | Stages 4, 5 | The cut-off curve, the confusion matrix and the comparison |
10Sample output
A real run, exactly as it appeared. Nothing below was typed by hand.
============================================================
WHO NEEDS A HELPING HAND?
============================================================
Who   : class teachers, and students who are falling behind
What  : struggling students are often noticed only after the exam
Where : a school, in the first months of the year
Why   : help given early can change the result

--- Stage 2: Data acquisition ---
Rows read    : 360
Columns read : 6

The first 10 rows:
   roll_no  attendance_pct  homework_pct  unit_test_avg  study_hours_week needs_support
0     9001              85            42           49.1                 2            No
1     9002              87            53           45.0                 1            No
2     9003              83            44           46.1                 4           Yes
3     9004              78            75           60.4                 6            No
4     9005              67            56           57.9                 5            No
5     9006              90           100           58.7                 6            No
6     9007              88            73           72.1                 9            No
7     9008              96            58           72.2                 9            No
8     9009              76            91           62.5                 7            No
9     9010              67            61           47.1                 5           Yes

--- Stage 3: Data exploration ---
Rows with no unit test average   : 3 (removed)
Rows with attendance above 100%  : 2 (removed)
Rows left                        : 355

Students who needed support and who did not:
needs_support
No     252
Yes    103
Name: count, dtype: int64

Average of each feature in the two groups:
               attendance_pct  homework_pct  unit_test_avg  study_hours_week
needs_support
No                       87.4          75.1           62.3               6.6
Yes                      79.7          55.0           38.6               3.4

--- Stage 4: Modelling ---
Training rows : 284
Testing rows  : 71

Rules tried                : 349
Learned rule               : flag if unit_test_avg < 42.9
Mistakes on training data  : 32 of 284
Teacher's rule             : flag if attendance_pct < 75

--- Stage 5: Evaluation ---
Teacher's rule
  Teacher's rule TP, FN, FP, TN : 2 17 2 50
  Teacher's rule accuracy  : 73.2 %
  Teacher's rule precision : 50.0 %
  Teacher's rule recall    : 10.5 %
  Teacher's rule F1 score  : 17.4 %

Learned rule
  Learned rule TP, FN, FP, TN : 13 6 1 51
  Learned rule accuracy  : 90.1 %
  Learned rule precision : 92.9 %
  Learned rule recall    : 68.4 %
  Learned rule F1 score  : 78.8 %

--- Stage 6: Deployment ---
Three students after the first unit tests:
Roll 9401 : attendance 92 %, unit tests 36.5 % -> suggest to the class teacher for extra classes
Roll 9402 : attendance 70 %, unit tests 64.0 % -> no flag
Roll 9403 : attendance 88 %, unit tests 71.5 % -> no flag
(The model only suggests. The class teacher decides, and talks to the student first.)11The same project without code
Orange's Tree widget builds decision trees. Limited to one level, it finds exactly the kind of single rule this program finds. The tool is Orange Data Mining.
Load student_records.csv. Set needs_support as the target and roll_no as a meta attribute.
Keep rows where attendance_pct is at most 100 and unit_test_avg is defined.
Plot attendance_pct against unit_test_avg, coloured by needs_support — chart 1.
Keep 80% for training; the rest for testing.
Set the maximal tree depth to 1. This gives a single rule.
See the question the tree chose. It should be about unit_test_avg.
Test on the testing data with target class Yes, and read the recall.
Count the students who were missed (the false negatives).
📘 Revise: No-Code AI, and Orange
12Testing
Every case below was actually run, and the result is what came back. Each one gives the whole program a small input of its own.
| Test case | Expected | Actual | Result |
|---|---|---|---|
| The full dataset | Rows read : 360 | Rows read : 360 | Pass |
| Blank unit test averages are removed | Rows with no unit test average : 3 (removed) | Rows with no unit test average : 3 (removed) | Pass |
| Attendance of 910% and 108% is removed | Rows with attendance above 100% : 2 (removed) | Rows with attendance above 100% : 2 (removed) | Pass |
| The computer picks the unit tests, not attendance | Learned rule : flag if unit_test_avg < 42.9 | Learned rule : flag if unit_test_avg < 42.9 | Pass |
| The attendance rule misses most students who need help | Teacher's rule recall : 10.5 % | Teacher's rule recall : 10.5 % | Pass |
| Struggling students with perfect attendance: the learned rule still finds them | Learned rule recall : 100.0 % | Learned rule recall : 100.0 % | Pass |
| ...while the attendance rule flags nobody | Teacher's rule recall : 0.0 % | Teacher's rule recall : 0.0 % | Pass |
| Boundary: 100% attendance is kept, 101% is removed | Rows with attendance above 100% : 1 (removed) | Rows with attendance above 100% : 1 (removed) | Pass |
| The data file is missing | FileNotFoundError: [Errno 2] No such file or directory: 'student_records.csv' | FileNotFoundError: [Errno 2] No such file or directory: 'student_records.csv' | Pass |
13Results, limits and what next
- The computer's best rule is about the unit tests, not attendance: flag if unit_test_avg < 42.9.
- The common attendance rule had an accuracy of 73.2 % but a recall of only 10.5 % — it misses almost every student who needs help.
- Most students who needed support in this data came to school regularly.
- The learned rule caught 68.4 % of them, with a precision of 92.9 %.
- A high accuracy can hide a useless rule when most of the data is in one group.
What this model cannot do
- Made-up data; the cut-off is an example, not advice for any real school
- A single rule cannot use two clues together, such as low marks and little homework
- It still misses some students who needed support
- Self-study hours come from a survey, which students may not answer honestly
What to add next
This is where you make the project your own. Take one of these, or an idea of yours:
- Let the computer find a second question for the students the first rule does not flag (a decision tree with two levels)
- Add a "just above the cut-off" list for teachers to keep an eye on
- Repeat after the half-yearly exam and see how the rule changes
- Build the same project on anonymous survey data from your class, with permission
What you may have to learn on your own
- How a computer can learn a rule by trying every cut-off and counting mistakes
- Decision trees and decision stumps
- Why accuracy can mislead when one group is much larger than the other
- The ethics of using AI to make decisions about people, and children especially
14Conclusion
The project found that the unit-test average is a far better early warning than attendance. The rule the computer learned caught 68.4 % of the students who needed support; the attendance rule caught 10.5 %.
The model is simple on purpose. A single readable rule is easy for teachers, parents and students to understand and to challenge, which matters more than a few extra percent of accuracy when the decisions are about children.
The biggest lesson is about evidence. Everybody assumed attendance was the warning sign. Testing that belief against data showed it was wrong — and that is worth more than the model itself.
15Questions for the viva
The project carries a viva voce of its own, worth 5 marks. These are the questions it is most likely to ask about this project. Try answering each one aloud before opening it.
▸How did your program learn its rule?
It tried every feature and every value as a cut-off, counted the mistakes each rule made on the training data, and kept the rule with the fewest.
▸Why is recall the most important measure here?
A false negative is a student who needed help and did not get it. That is worse than inviting a student to extra classes they did not need.
▸The attendance rule had over 70% accuracy. Why is it a bad rule?
Its recall was only about 10%. Most students do not need support, so a rule that flags almost nobody is right about most students but misses the ones who matter.
▸What is a decision stump?
A decision tree with only one question, such as "is the unit-test average below 42.9?"
▸What ethical care does a project like this need?
Privacy (roll numbers, data kept by the school), no public labels, a teacher makes every decision, and the rule must be checked for bias before it is used elsewhere.
▸Why did you remove attendance values above 100?
A percentage cannot be more than 100, so those are typing mistakes.
▸Which SDG does it relate to?
SDG 4, Quality Education, and SDG 10, Reduced Inequalities.
16References
- UNESCO, SDG 4 — Education 2030 — https://www.unesco.org/sdg4education2030/
- Ministry of Education, Government of India, National Education Policy 2020 — on early identification and support for students who fall behind.
- Orange Data Mining, Tree widget — https://orangedatamining.com/widget-catalog/model/tree/
- CBSE, Artificial Intelligence (Subject Code 417), Class X curriculum, 2026-27 — Part C, Practical and Project Work
- CBSE, Artificial Intelligence Facilitator Handbook, Class X
- pandas — https://pandas.pydata.org/docs/; NumPy — https://numpy.org/doc/; Matplotlib — https://matplotlib.org/stable/
- LambdaLab — https://www.lambdalab.in