What Shape Is This Sign?
Reading an image and identifying its shape — the practical-file program, grown into a project that tells mandatory, cautionary and informatory road signs apart.
1Introduction
Indian road signs are designed so that their shape tells you what kind of sign they are, even before you can read them. A red circle is an order (mandatory). A red triangle warns of danger (cautionary). A blue rectangle gives information (informatory).
At speed, at night, or when distracted, a driver can miss a sign altogether. Modern cars carry a camera that could read signs and warn the driver.
The curriculum's practical file includes the program "read an image and identify its shape using Python". This project grows that program into a full AI project: from a photo of a sign, find its shape, and so its type.
Good Health and Well-being
Sustainable Cities and Communities
SDG target 3.6 is to halve deaths and injuries from road accidents, and India loses more lives on its roads than almost any other country. Many accidents happen when a driver misses a sign. A car that can read signs and warn a distracted driver is one of the ways AI can help — and safe roads are part of SDG 11's sustainable cities.
The curriculum asks that the project be related to the Sustainable Development Goals. That link is the reason the problem is worth solving, so it belongs at the very start of the report, not tacked on at the end.
2Stage 1 — Problem Scoping
Problem scoping means understanding the problem properly before building anything. The tool for it is the 4Ws Problem Canvas: who has the problem, what the problem is, where it happens, and why solving it matters.
- Drivers, especially when tired or distracted
- Makers of driver-assistance systems
- Signs missed at speed can lead to accidents
- A driver may not notice a warning sign in time
- Indian roads and highways
- Most dangerously at night, in rain and at high speed
- A warning from the car can prevent an accident
- Fewer road deaths and injuries
The problem statement
The four answers are then joined into one sentence, using the curriculum's problem statement template:
Makers of driver-assistance systems in cars, and driving schools teaching what each sign shape means.
How it is done today
Usually enough — until the driver is tired, distracted, or the sign is half-hidden.
Some newer cars already read signs with a camera, using deep learning trained on huge sets of photos. This project shows the simplest version of what they do.
Maps know some speed limits, but not a temporary sign or a new warning put up yesterday.
Objectives
- To read photos of road signs and show them
- To find the sign in each photo by its colour
- To describe the sign's shape with two numbers: how much of its box it fills, and how wide its top is
- To build a rule based model from geometry, and a learning based model from examples
- To compare them on unseen photos and find out why one fails
- To identify the shape and type of new signs
📘 Revise: Stage 1 — Problem Scoping
3Stage 2 — Data Acquisition
The data is a folder of sign photos sorted by shape: images/circle/, images/triangle/ and images/rectangle/.
There are 150 photos, 96 × 96 pixels each. The signs vary in size, position and lighting; they are tilted slightly, as real signs often are; and in about one photo in five a branch hides part of the sign. Three more photos in new_photos/ are used for deployment.
The signs were drawn by a program and carry no real symbols. For your own project, photograph signs near your school — safely, from the footpath, never from a moving vehicle — or use a public traffic-sign dataset and credit it.
Features and label
The features are what the model is given. The label is the answer it has to learn to give.
| Column | Type | What it holds | Role |
|---|---|---|---|
fill | decimal | The sign's area ÷ the area of the box around it | feature |
top | decimal | Average width of the top quarter of the sign ÷ its widest row | feature |
label | text | circle, triangle or rectangle — the folder it came from | label |
photo | file | The sign photo, read as a 96 × 96 × 3 array | not used |
colour | text | red or blue — whichever the sign has more of | not used |
Inside the images/ folder
Road sign photos sorted into a folder for each shape. There are 150 images, 3121.2 KB in all, one folder per class — the same layout Teachable Machine and Orange expect:
The images come with the project download.
Inside the new_photos/ folder
Three new signs, used in the deployment stage. There are 3 images, 62.5 KB in all.
The images come with the project download.
📘 Revise: Stage 2 — Data Acquisition
4Stage 3 — Data Exploration
Data exploration means getting to know the data before trusting it: fixing what is wrong with it, then drawing it to see the patterns. The charts here are what decide what the model should be.
What was wrong with the data
The background is grey or green; the sign's border is strongly red or strongly blue. A pixel whose red is far above its green and blue (or whose blue is far above the others) is counted as part of the sign.
The white centre is not red or blue, so it would be missed. Instead, for every row the program measures from the leftmost coloured pixel to the rightmost. Adding up those widths gives the whole sign's area, middle included.
Both features are ratios — area ÷ box, top ÷ widest — so a small, far-away sign gives the same numbers as a big, close one.
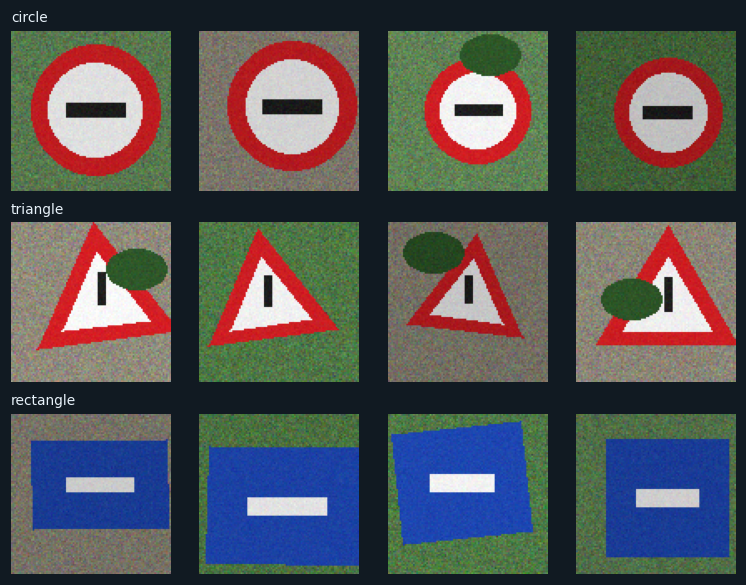
One row per shape, read from the folders and shown with plt.imshow().
To a person the three shapes are obvious. To a computer each photo is just 27,648 numbers. The job is to turn those numbers into something that describes shape.
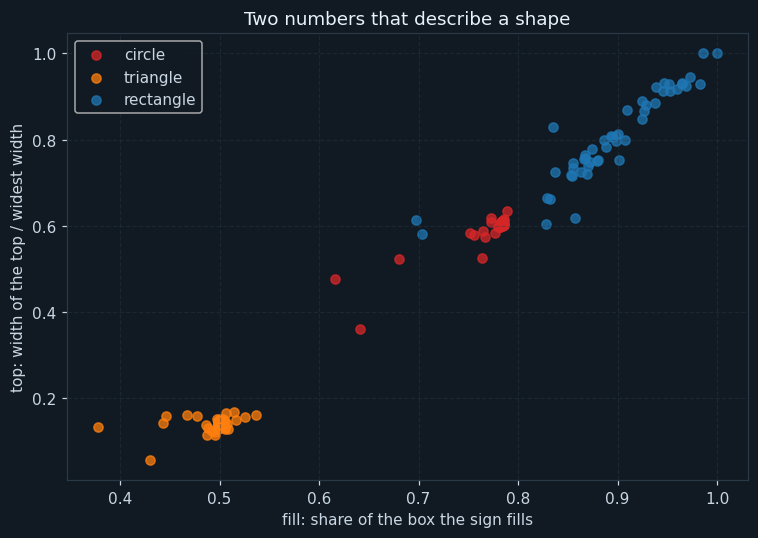
Each dot is one photo: its fill across and its top up.
The shapes fall into three clear clouds. Triangles are bottom left: they fill about half of their box and have a narrow top. Circles are in the middle: they fill about 0.78 of their box — close to π/4, the share of a square a circle covers. Rectangles are top right.
Look closely at the rectangles: their fill is not always 1.0 but spread from about 0.7 to 1.0. A tilted rectangle no longer lines up with its box, so it fills less of it, and a branch hiding a corner lowers it further. That detail decides the next stage.
📘 Revise: Stage 3 — Data Exploration
5Stage 4 — Modelling
Where this model sits in the family of AI models:
The answer is one of three shapes, so this is classification. The photos are labelled by folder, so it is supervised learning, in the Computer Vision domain.
How the model works
The photos are split into 120 for training and 30 for testing.
Model A is rule based, written from geometry with no training at all: a rectangle fills nearly all of its box (more than 0.9); of the rest, a triangle has a narrow top (below 0.45); anything else is a circle.
Model B is learning based. It learns the average fill and top of each shape from the training photos, and gives a new sign the shape whose average is nearest.
📘 Revise: Stage 4 — Modelling
6Stage 5 — Evaluation
The rule based model got 23 of 30 correct — an accuracy of 76.7 %. The learning based model got 30 of 30 correct — 100.0 %.
The difference is the most useful result of the project. The rules were written for perfect shapes. Real signs are tilted a little, and a tilt changes the numbers enough to break a rule written by hand. The learning based model never had to be told about tilting: it learned what rectangles really look like from photos that were tilted, and its average fill for a rectangle (about 0.89) already allows for it.
This is the difference between rule based and learning based AI from Unit 2, seen in a real case. A rule is only as good as what its writer thought of. Learning from examples picks up what the writer did not.
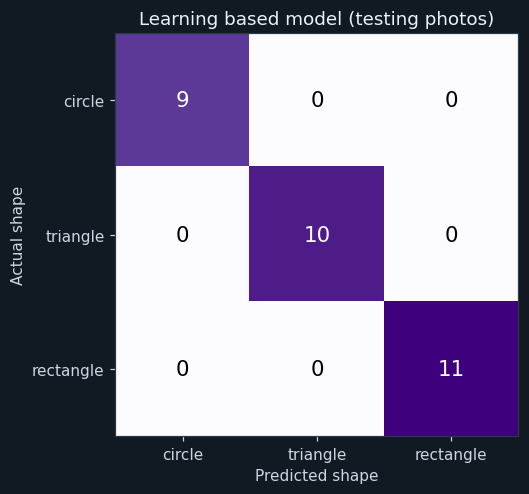
Rows are the real shapes; columns are what the learning based model said. The diagonal holds the correct answers.
Everything is on the diagonal: the learning based model identified every testing sign correctly.

Every testing photo that a model got wrong. All of them were mistakes by the rule based model.
Every one is a blue rectangle whose fill came out between about 0.84 and 0.90. The rule said "a rectangle fills more than 90% of its box" — true for a perfectly straight, fully visible rectangle. Tilt it a few degrees, or let a branch hide a corner, and the fill drops below 0.9, so the rule called it a circle.
📘 Revise: The Confusion Matrix
7Stage 6 — Deployment
The program identifies the shape and type of three new signs and labels each photo. In a car, the same steps would run on every camera frame, and the dashboard would show a symbol — or sound a chime — for a cautionary sign ahead.
Identifying the shape is only the first step. A real system would then read the symbol inside the sign (a speed limit, a school, a sharp bend), which needs a much larger model, such as a CNN.
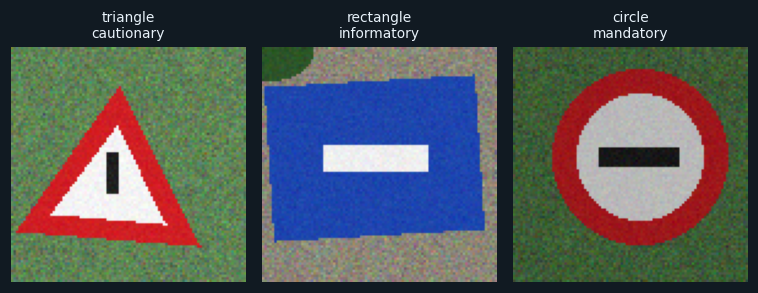
Three new signs, each with the shape and type the model gave it.
All three are identified correctly — a cautionary triangle, an informatory rectangle and a mandatory circle.
📘 Revise: Stage 6 — Deployment
8Ethical concerns
An AI project is not finished when the model works. The curriculum asks three questions of every model — is it fair (bias), can it explain itself (transparency), and who answers for its mistakes (accountability). For this project:
A sign-reading system helps the driver; it does not drive. If it misses a sign, the driver is still responsible. It must never make a driver pay less attention.
The model learned clean, mostly visible signs in daylight. Faded paint, night, rain or a sign hidden by a tree can fool it. A real system must be tested in all of these before it is trusted.
Photos for a project must be taken from a safe place, never while driving or riding, and without photographing people's faces or vehicle number plates.
📘 Revise: Bias, Transparency, Accountability
9Source code
The whole program — it is also in the downloads at the top of this page — in Python with pandas, NumPy and matplotlib — the three libraries of Unit 7. It is laid out as the six stages of the AI Project Cycle, one after another. Every chart on this page was drawn by it, and every number came out of running it.
# ---------------------------------------------------------------------------
# road_signs.py
#
# AI project on Computer Vision: reading a photo of a road sign and
# identifying its shape - and so what kind of sign it is.
#
# CBSE Class X, Artificial Intelligence (417), Part C project work.
# SDG 3 (Good Health and Well-being - target 3.6, road safety) and
# SDG 11 (Sustainable Cities and Communities).
#
# In India the shape of a road sign tells you its type before you can read it:
#   circle    (red)  - MANDATORY: an order you must obey
#   triangle  (red)  - CAUTIONARY: danger ahead
#   rectangle (blue) - INFORMATORY: useful information
#
# Shape is turned into two numbers (FEATURES):
#   fill  - how much of the box around the sign the sign fills
#           (a rectangle fills almost all of it, a circle about 0.79,
#           a triangle about half)
#   top   - how wide the top of the sign is, compared with its widest row
#           (a triangle is narrow at the top)
# Then two models are compared: a RULE BASED model written from geometry,
# and a LEARNING BASED model that learns the average of each shape.
#
# Libraries: numpy, matplotlib (images and charts), pandas, os.
# ---------------------------------------------------------------------------

# %% Stage 1 - Problem scoping
print("=" * 60)
print("WHAT SHAPE IS THIS SIGN?")
print("=" * 60)
print("Who   : drivers, and the makers of driver-assistance systems")
print("What  : a sign missed at speed can cause an accident")
print("Where : Indian roads, where the shape tells the type of sign")
print("Why   : a car that reads signs can warn a distracted driver")
print()

# %% Stage 2 - Data acquisition
import os
import numpy as np
import pandas as pd
import matplotlib.pyplot as plt

pd.set_option("display.width", 120)

shapes = ["circle", "triangle", "rectangle"]
meaning = {"circle": "MANDATORY", "triangle": "CAUTIONARY", "rectangle": "INFORMATORY"}

paths = []
labels = []
for s in shapes:
    for name in sorted(os.listdir(os.path.join("images", s))):
        paths.append(os.path.join("images", s, name))
        labels.append(s)

print("--- Stage 2: Data acquisition ---")
for s in shapes:
    print(s.ljust(10), "photos :", labels.count(s))
print("Total photos      :", len(paths))
print()

# Chart 1: four photos of each shape.
plt.figure(figsize=(7, 5.4))
for r in range(3):
    group = []
    for i in range(len(paths)):
        if labels[i] == shapes[r]:
            group.append(paths[i])
    for c in range(4):
        plt.subplot(3, 4, r * 4 + c + 1)
        plt.imshow(plt.imread(group[c * len(group) // 4]))
        plt.axis("off")
        if c == 0:
            plt.title(shapes[r], fontsize=9, loc="left")
plt.tight_layout()
plt.savefig("chart1_sample_signs.png")
plt.close()

# %% Stage 3 - Data exploration
print("--- Stage 3: Data exploration ---")

# Step 1 - find the sign. Its border is strongly red or strongly blue, which
# the grey and green background never is.
# Step 2 - for every row of the photo, measure the sign's width from its
# leftmost coloured pixel to its rightmost. Adding those widths up gives the
# sign's area, white middle included.
rows = []
for i in range(len(paths)):
    img = plt.imread(paths[i])[:, :, :3].astype(float) * 255
    r, g, b = img[:, :, 0], img[:, :, 1], img[:, :, 2]
    red = (r > g + 70) & (r > b + 70)
    blue = (b > r + 60) & (b > g + 40)
    coloured = red | blue
    widths = []
    for y in range(img.shape[0]):
        xs = np.where(coloured[y])[0]
        if len(xs) > 0:
            widths.append(xs[-1] - xs[0] + 1)
    widths = np.array(widths)
    height = len(widths)
    box = height * widths.max()
    fill = widths.sum() / box
    top = widths[: max(1, height // 4)].mean() / widths.max()
    if red.sum() > blue.sum():
        colour = "red"
    else:
        colour = "blue"
    rows.append([paths[i], labels[i], colour, round(fill, 3), round(top, 3)])

data = pd.DataFrame(rows, columns=["photo", "label", "colour", "fill", "top"])
print("Average features of each shape:")
print(data.groupby("label")[["fill", "top"]].mean().round(3).reindex(shapes))
print()
print("Colour found for each shape:")
print(pd.crosstab(data["label"], data["colour"]).reindex(shapes))
print()

# Chart 2: the two features, one dot per photo.
plt.figure(figsize=(7, 5))
dot_colours = ["#d62728", "#ff7f0e", "#1f77b4"]
for k in range(3):
    part = data[data["label"] == shapes[k]]
    plt.scatter(part["fill"], part["top"], color=dot_colours[k], label=shapes[k], alpha=0.75)
plt.title("Two numbers that describe a shape")
plt.xlabel("fill: share of the box the sign fills")
plt.ylabel("top: width of the top / widest width")
plt.legend()
plt.grid(True, linestyle="--", alpha=0.4)
plt.tight_layout()
plt.savefig("chart2_shape_features.png")
plt.close()

# %% Stage 4 - Modelling
print("--- Stage 4: Modelling ---")
use = ["fill", "top"]
data = data.sample(frac=1, random_state=6)
cut = int(len(data) * 0.8)
train = data[:cut]
test = data[cut:]
print("Training photos :", len(train))
print("Testing photos  :", len(test))
print()

# Model A - RULE BASED, from geometry alone, with no training at all:
#   a rectangle fills nearly all of its box; of the rest, a triangle has a
#   narrow top and a circle does not.
rule = []
for i in range(len(test)):
    row = test.iloc[i]
    if row["fill"] > 0.9:
        rule.append("rectangle")
    elif row["top"] < 0.45:
        rule.append("triangle")
    else:
        rule.append("circle")

# Model B - LEARNING BASED: the average fill and top of each shape, learned
# from the training photos; a new sign gets the nearest average.
averages = train.groupby("label")[use].mean()
print("What model B learned - the average of each shape:")
print(averages.round(3).reindex(shapes))
print()
learned = []
for i in range(len(test)):
    distance = ((averages - test[use].iloc[i]) ** 2).sum(axis=1)
    learned.append(distance.idxmin())

# %% Stage 5 - Evaluation
print("--- Stage 5: Evaluation ---")
actual = list(test["label"])
rule_right = 0
learned_right = 0
for i in range(len(actual)):
    if rule[i] == actual[i]:
        rule_right = rule_right + 1
    if learned[i] == actual[i]:
        learned_right = learned_right + 1
print("Rule based     :", rule_right, "of", len(actual), "correct")
print("Learning based :", learned_right, "of", len(actual), "correct")
print("Accuracy of the rule based model     :", round(rule_right / len(actual) * 100, 1), "%")
print("Accuracy of the learning based model :", round(learned_right / len(actual) * 100, 1), "%")
print()

matrix = pd.crosstab(pd.Series(actual, name="Actual"), pd.Series(learned, name="Predicted"))
matrix = matrix.reindex(index=shapes, columns=shapes, fill_value=0)
print("Confusion matrix of the learning based model:")
print(matrix)
print()

wrong = []
for i in range(len(actual)):
    if learned[i] != actual[i] or rule[i] != actual[i]:
        wrong.append(i)
print("Photos at least one model got wrong :", len(wrong))
for i in wrong:
    row = test.iloc[i]
    print("  " + os.path.basename(row["photo"]).ljust(18), "fill", row["fill"], " top", row["top"],
          " rule said", rule[i], " learned said", learned[i])
print()

# Chart 3: confusion matrix.
plt.figure(figsize=(5.5, 4.6))
plt.imshow(matrix.values, cmap="Purples")
for r in range(3):
    for c in range(3):
        value = matrix.values[r][c]
        if value > matrix.values.max() / 2:
            ink = "white"
        else:
            ink = "black"
        plt.text(c, r, value, ha="center", va="center", fontsize=14, color=ink)
plt.xticks(range(3), shapes)
plt.yticks(range(3), shapes)
plt.xlabel("Predicted shape")
plt.ylabel("Actual shape")
plt.title("Learning based model (testing photos)")
plt.tight_layout()
plt.savefig("chart3_matrix.png")
plt.close()

# Chart 4: the photos that fooled a model.
if len(wrong) > 0:
    plt.figure(figsize=(2 * len(wrong) + 0.5, 2.6))
    for n in range(len(wrong)):
        row = test.iloc[wrong[n]]
        plt.subplot(1, len(wrong), n + 1)
        plt.imshow(plt.imread(row["photo"]))
        plt.title("really " + row["label"], fontsize=9)
        plt.axis("off")
    plt.tight_layout()
    plt.savefig("chart4_mistakes.png")
    plt.close()

# %% Stage 6 - Deployment
print("--- Stage 6: Deployment ---")
new_names = sorted(os.listdir("new_photos"))
plt.figure(figsize=(7, 2.8))
for i in range(len(new_names)):
    photo = plt.imread(os.path.join("new_photos", new_names[i]))[:, :, :3]
    img = photo.astype(float) * 255
    r, g, b = img[:, :, 0], img[:, :, 1], img[:, :, 2]
    coloured = ((r > g + 70) & (r > b + 70)) | ((b > r + 60) & (b > g + 40))
    widths = []
    for y in range(img.shape[0]):
        xs = np.where(coloured[y])[0]
        if len(xs) > 0:
            widths.append(xs[-1] - xs[0] + 1)
    widths = np.array(widths)
    point = pd.Series({
        "fill": widths.sum() / (len(widths) * widths.max()),
        "top": widths[: max(1, len(widths) // 4)].mean() / widths.max(),
    })
    shape = ((averages - point) ** 2).sum(axis=1).idxmin()
    print(new_names[i], "-> fill", round(point["fill"], 2), " top", round(point["top"], 2),
          "->", shape, "->", meaning[shape], "sign")
    plt.subplot(1, len(new_names), i + 1)
    plt.imshow(photo)
    plt.title(shape + "\n" + meaning[shape].lower(), fontsize=9)
    plt.axis("off")
plt.tight_layout()
plt.savefig("chart5_new_signs.png")
plt.close()
The library calls it is built from
| Call | Where | What it does |
|---|---|---|
plt.imread() / plt.imshow() | Stages 2, 5, 6 | Reads and shows the photos |
(r > g + 70) & (r > b + 70) | Stage 3 | Marks strongly red pixels |
red | blue | Stage 3 | Combines the red and blue masks |
np.where(coloured[y])[0] | Stage 3 | The coloured pixels in one row |
xs[-1] - xs[0] + 1 | Stage 3 | The width of the sign in that row |
widths.sum() / box | Stage 3 | The fill feature |
pd.crosstab() | Stages 3, 5 | Colour by shape, and the confusion matrix |
groupby(...).mean() | Stage 4 | The average fill and top of each shape |
idxmin() | Stages 4, 6 | The nearest average |
10Sample output
A real run, exactly as it appeared. Nothing below was typed by hand.
============================================================
WHAT SHAPE IS THIS SIGN?
============================================================
Who   : drivers, and the makers of driver-assistance systems
What  : a sign missed at speed can cause an accident
Where : Indian roads, where the shape tells the type of sign
Why   : a car that reads signs can warn a distracted driver

--- Stage 2: Data acquisition ---
circle     photos : 50
triangle   photos : 50
rectangle  photos : 50
Total photos      : 150

--- Stage 3: Data exploration ---
Average features of each shape:
            fill    top
label
circle     0.773  0.592
triangle   0.495  0.139
rectangle  0.894  0.806

Colour found for each shape:
colour     blue  red
label
circle        0   50
triangle      0   50
rectangle    50    0

--- Stage 4: Modelling ---
Training photos : 120
Testing photos  : 30

What model B learned - the average of each shape:
            fill    top
label
circle     0.771  0.592
triangle   0.493  0.139
rectangle  0.893  0.805

--- Stage 5: Evaluation ---
Rule based     : 23 of 30 correct
Learning based : 30 of 30 correct
Accuracy of the rule based model     : 76.7 %
Accuracy of the learning based model : 100.0 %

Confusion matrix of the learning based model:
Predicted  circle  triangle  rectangle
Actual
circle          9         0          0
triangle        0        10          0
rectangle       0         0         11

Photos at least one model got wrong : 7
  rectangle_027.png  fill 0.837  top 0.725  rule said circle  learned said rectangle
  rectangle_045.png  fill 0.867  top 0.765  rule said circle  learned said rectangle
  rectangle_044.png  fill 0.854  top 0.716  rule said circle  learned said rectangle
  rectangle_015.png  fill 0.869  top 0.721  rule said circle  learned said rectangle
  rectangle_026.png  fill 0.879  top 0.751  rule said circle  learned said rectangle
  rectangle_031.png  fill 0.898  top 0.797  rule said circle  learned said rectangle
  rectangle_049.png  fill 0.866  top 0.756  rule said circle  learned said rectangle

--- Stage 6: Deployment ---
sign_1.png -> fill 0.5  top 0.14 -> triangle -> CAUTIONARY sign
sign_2.png -> fill 0.89  top 0.76 -> rectangle -> INFORMATORY sign
sign_3.png -> fill 0.78 top 0.61 -> circle -> MANDATORY sign11The same project without code
A Teachable Machine model learns shape from the pixels by itself, with no fill or top measured by hand — a good comparison with the features in this program. The tool is Teachable Machine (or Orange with the Image Analytics add-on).
Choose an Image Project, standard image model.
Name them circle, triangle and rectangle, and upload each folder.
Train it, and open Advanced to see the accuracy per class.
Test the signs in new_photos, and try photos of real signs held up to the webcam.
Load the images folder and turn the photos into features.
Train and test a three-class model.
Check whether any rectangles are confused with circles.
📘 Revise: No-Code AI, and Orange
12Testing
Every case below was actually run, and the result is what came back. Each one gives the whole program a small input of its own.
| Test case | Expected | Actual | Result |
|---|---|---|---|
| All 150 photos are read | Total photos : 150 | Total photos : 150 | Pass |
| Every rectangle is found to be blue, every circle and triangle red | rectangle 50 0 | rectangle 50 0 | Pass |
| The geometry rule is fooled by tilted rectangles | Accuracy of the rule based model : 76.7 % | Accuracy of the rule based model : 76.7 % | Pass |
| The learned model, trained on tilted signs too, is not | Accuracy of the learning based model : 100.0 % | Accuracy of the learning based model : 100.0 % | Pass |
| A perfect upright triangle: fill about 0.5, narrow top | sign_1.png -> fill 0.51 top 0.13 -> triangle -> CAUTIONARY sign | sign_1.png -> fill 0.51 top 0.13 -> triangle -> CAUTIONARY sign | Pass |
| A perfect rectangle fills its whole box | sign_2.png -> fill 1.0 top 1.0 -> rectangle -> INFORMATORY sign | sign_2.png -> fill 1.0 top 1.0 -> rectangle -> INFORMATORY sign | Pass |
| A perfect circle fills pi/4 = 0.785 of its box; on pixels, 0.78 | sign_3.png -> fill 0.78 top 0.6 -> circle -> MANDATORY sign | sign_3.png -> fill 0.78 top 0.6 -> circle -> MANDATORY sign | Pass |
| A small, far-away circle is still a circle | sign_1.png -> fill 0.78 top 0.6 -> circle -> MANDATORY sign | sign_1.png -> fill 0.78 top 0.6 -> circle -> MANDATORY sign | Pass |
13Results, limits and what next
- Two numbers describe a shape well: the share of its box it fills, and how wide its top is.
- A circle fills about 0.78 of its box (close to π/4), a triangle about half, a rectangle nearly all.
- The rule based model scored 76.7 %; every mistake was a rectangle that was tilted or partly hidden.
- The learning based model scored 100.0 %, because it learned from tilted examples.
- Colour agreed with shape every time: all circles and triangles red, all rectangles blue.
What this model cannot do
- Drawn signs; real photos have glare, fading, dirt and complex backgrounds
- A large tilt, or a sign seen from the side, changes both features
- It finds shape, not the symbol inside — it cannot tell a speed limit from a no-entry sign
- It assumes one sign per photo
What to add next
This is where you make the project your own. Take one of these, or an idea of yours:
- Add an octagon class for the STOP sign
- Use colour as a third feature and see if it helps with hidden signs
- Photograph real signs near your school, safely, and retrain
- Compare with a Teachable Machine model that learns from the pixels
What you may have to learn on your own
- Reading an image and finding an object by colour
- Turning shape into numbers with ratios
- Why a rule written for perfect cases can fail on real data
- What each Indian road sign shape means — from the Road Regulations or a driving manual
14Conclusion
The project took the practical-file program "identify the shape of an image" and made it useful: from a photo, it finds a road sign, measures its shape and says what kind of sign it is. The learning based model identified every testing sign correctly.
The most valuable result was the rule based model's failure. Rules written from perfect geometry broke on signs tilted by just a few degrees. The learned model coped because it had seen tilted signs. That is a lesson worth more than the 100%: real data is never as neat as the rule-writer imagines.
Shape is the first step to reading a sign. Reading the symbol inside it needs a bigger model — a CNN — which is where this project would go next.
15Questions for the viva
The project carries a viva voce of its own, worth 5 marks. These are the questions it is most likely to ask about this project. Try answering each one aloud before opening it.
▸What does the shape of an Indian road sign tell you?
A red circle is mandatory, a red triangle is cautionary, and a blue rectangle is informatory.
▸What are your two features?
fill — the sign's area divided by the area of the box around it — and top — how wide the top of the sign is compared with its widest row.
▸Why does a circle have a fill of about 0.78?
A circle covers π/4, about 0.785, of the square around it. On pixels it comes out at 0.78.
▸Why did your rule based model fail?
It assumed a rectangle fills more than 90% of its box. A slightly tilted rectangle fills only about 85%, so the rule called it a circle.
▸Why did the learning based model not make that mistake?
It learned the average fill of rectangles from training photos that were tilted, so it already allowed for the tilt.
▸How did you find the sign in the photo?
By colour. The sign's border is strongly red or blue, and the background is not.
▸Which SDGs does it relate to?
SDG 3, Good Health and Well-being (target 3.6, road safety), and SDG 11, Sustainable Cities and Communities.
16References
- Ministry of Road Transport and Highways, Government of India — road signs and road safety — https://morth.nic.in/
- Indian Roads Congress, IRC:67 — Code of Practice for Road Signs.
- World Health Organization, Road traffic injuries fact sheet — https://www.who.int/news-room/fact-sheets/detail/road-traffic-injuries
- Teachable Machine — https://teachablemachine.withgoogle.com/
- CBSE, Artificial Intelligence (Subject Code 417), Class X curriculum, 2026-27 — Part C, Practical and Project Work
- CBSE, Artificial Intelligence Facilitator Handbook, Class X
- pandas — https://pandas.pydata.org/docs/; NumPy — https://numpy.org/doc/; Matplotlib — https://matplotlib.org/stable/
- LambdaLab — https://www.lambdalab.in