A Flood Early-Warning Model
A rare-event capstone: a next-day flood warning from rain, river and dam data, where a model that never warns would score 95% — so it is judged on recall and false alarms, validated monsoon by monsoon, and replayed on a new monsoon as feedback.
1Introduction
Every monsoon, some rivers rise past their danger level. Villages and towns on the banks often get little warning: the water rises overnight, after heavy rain far upstream or a sudden release from a dam.
Rain gauges, river gauges and dam reports already record what is happening upstream. The Central Water Commission issues flood forecasts for major rivers, but many smaller rivers and towns have no forecast of their own.
This capstone builds a next-day flood warning for one river gauge. Its difficulty is not the modelling but the rarity of floods: on most days nothing happens, so a model can look excellent while being useless. Following the Data Science Methodology, it is judged on the measures that matter for a warning — floods caught and false alarms raised.
Climate Action
Sustainable Cities and Communities
SDG target 13.1 asks every country to strengthen resilience to climate-related hazards, and target 11.5 to cut deaths and losses from disasters, especially for the poor. Floods are India's most frequent disaster, and a warning even a day ahead lets families move to safety, take cattle and documents, and lets the administration open shelters — the difference between a flood that destroys property and one that also takes lives.
2Step 1 — Business Understanding
What is the problem that you are trying to solve? The handbook uses the 5W1H Problem Canvas for this step.
- • Families in villages and towns along the river
- • District disaster management authorities
- • Gram panchayats who pass warnings on
- • Floods arrive with little or no warning
- • Too many false alarms make people ignore real ones
- • The river reach downstream of one gauge station
- • Each evening of the monsoon, for the next day
- • A day's warning saves lives, livestock and documents
- • Shelters and boats can be ready in time
- • Learn from ten monsoons of rain, river and dam data
- • Estimate tomorrow's flood probability each evening, and warn above a threshold
Problem statement
Who would use it: District disaster management authorities and the gram panchayats of villages along the river, who issue and act on flood warnings.
Talking to the stakeholders
The handbook pairs the 5W1H canvas with Design Thinking, which begins by empathising with the people who have the problem. The questions asked, and what each answer changed:
| Question asked | What we learned, and what it changed |
|---|---|
| To a disaster management officer: how much warning do you need? | One day is enough to move people and cattle and open shelters. That fixed the prediction target: a flood the next day. |
| To the same officer: which is worse — a missed flood or a false alarm? | A missed flood, by far. But too many false alarms and villagers stop moving. Recall comes first, but false alarms must be counted and kept low. |
| To a river-gauge reader: what tells you the river will rise? | Heavy rain upstream for two or three days, wet ground, and dam releases. Those became features — including three-day rain totals. |
| To the gauge reader: are your records complete? | The local rain gauge sometimes fails; the upstream gauge rarely does. So a blank local reading is filled from the upstream gauge, not an average. |
| To a villager: what happened in the last flood? | The river rose at night after rain in the hills where there is no gauge. A warning that part of the cause is never measured — the model cannot be perfect. |
| To a panchayat member: how should a warning reach people? | SMS to the panchayat and an announcement. So deployment means a clear yes/no warning, not a percentage. |
How it is handled today
Expert hydrological forecasts for major rivers at hundreds of stations. Many smaller rivers and towns are not covered.
A gauge reader raises the alarm when the river is close to danger. Reliable, but often only hours ahead — too late to move people at night.
The meteorological department's heavy-rain warnings are valuable, but heavy rain does not always mean a flood at a given town.
Objectives
- To frame next-day flood warning with the 5W1H canvas
- To collect and understand ten monsoons of daily rain, river and dam data
- To show why accuracy is misleading for a rare event, and choose recall, precision and F1 instead
- To engineer features such as three-day rain totals and distance below the danger level
- To train Logistic Regression and a Random Forest with class weighting, test them on the two latest monsoons, and cross-validate them one monsoon at a time
- To deploy an evening warning, and replay a new monsoon as feedback
3Step 2 — Analytic Approach
Whether the river will cross its danger level tomorrow is a yes/no prediction from today's data — predictive analytics with binary classification.
Because floods are rare, the dataset is unbalanced: about one day in twenty. The handbook warns that for unbalanced data accuracy is misleading and precision, recall or F1 should be used instead; this project is built around that warning.
| Candidate | Why it was considered |
|---|---|
| Logistic Regression (balanced) | Gives a flood probability and readable coefficients. class_weight="balanced" makes a missed flood day count as much as all the calm days together. |
| Random Forest (balanced) | Captures interactions — heavy rain matters more when the ground is already wet — with the same class weighting. |
| Never warn (baseline) | Not a model to use: the benchmark that shows how meaningless accuracy is here. |
4Step 3 — Data Requirements
The data must cover many monsoons, because floods are rare: ten monsoons give a few dozen flood days, just enough to learn from. Each row is one monsoon day, with the measurements known that evening and whether the river crossed the danger level the next day.
Because the warning is issued the evening before, every feature must be available by evening: today's rain and river level, not tomorrow's.
| Data needed | Type | Format | Source |
|---|---|---|---|
| Local and upstream rainfall | Numeric | mm per day | Rain gauges (IMD / state) |
| River level and 24-hour rise | Numeric | metres | River gauge station (CWC / state) |
| Soil wetness | Numeric | 0 to 1 index | Estimated from recent rain / remote sensing |
| Dam release upstream | Numeric | cumecs | Dam authority |
| Flood the next day (label) | Binary | 1 if the level exceeds 104 m tomorrow | Derived from the gauge record |
5Step 4 — Data Collection
All of this is secondary data: river levels from the Central Water Commission or the state water resources department, rainfall from the India Meteorological Department and state rain gauges, and dam releases from the dam authority. Interviews with gauge readers and villagers are primary data, and shaped the features.
The sample file, river_gauge.csv, holds 1211 monsoon days from 2015 to 2024. monsoon_2025.csv holds the next monsoon and is used only for feedback.
As the villager warned, part of what raises the river is rain in hills with no gauge. The sample data includes that unmeasured rain, so the model faces the same limit a real one would.
| Column | Type | What it holds | Role |
|---|---|---|---|
date | date | The monsoon day | used for the year split |
rain_mm | decimal | Rain at the town's gauge, mm; sometimes blank | feature |
upstream_rain_mm | decimal | Rain at the upstream gauge, mm | feature |
river_level_m | decimal | River level today, m (danger level 104 m) | feature |
rise_24h_m | decimal | Change in level over the last 24 hours, m | feature |
soil_wetness | decimal | How saturated the ground is, 0 to 1 | feature |
dam_release_cumecs | decimal | Water released by the upstream dam | feature |
rain_3day_mm, upstream_3day_mm, metres_below_danger | decimal | Made by the program | engineered features |
flood_next_day | 0 / 1 | 1 if the river crosses 104 m tomorrow | target |
river_gauge.csv — Ten monsoons of daily rain, river and dam data, with next-day flood labels. 1,211 rows, 50.6 KB. Download the file
monsoon_2025.csv — The 2025 monsoon, used only for feedback. 121 rows, 5.1 KB. Download the file
The first eight rows of river_gauge.csv
| date | rain_mm | upstream_rain_mm | river_level_m | soil_wetness | dam_release_cumecs | rise_24h_m | flood_next_day |
|---|---|---|---|---|---|---|---|
2015-06-01 | 0.0 | 13.9 | 97.14 | 0.27 | 0.0 | 0.0 | 0 |
2015-06-02 | 0.0 | 0.0 | 97.71 | 0.24 | 15.0 | 0.57 | 0 |
2015-06-03 | 0.0 | 0.0 | 96.6 | 0.22 | 0.0 | -1.11 | 0 |
2015-06-04 | 3.9 | 0.3 | 96.83 | 0.22 | 0.0 | 0.23 | 0 |
2015-06-05 | 11.1 | 3.9 | 97.18 | 0.26 | 0.0 | 0.35 | 0 |
2015-06-06 | 0.0 | 4.7 | 98.38 | 0.23 | 0.0 | 1.2 | 0 |
2015-06-07 | 0.0 | 2.6 | 97.25 | 0.21 | 0.0 | -1.13 | 0 |
2015-06-08 | 22.7 | 0.3 | 97.65 | 0.31 | 2.0 | 0.4 | 0 |
The first four rows of monsoon_2025.csv
| date | rain_mm | upstream_rain_mm | river_level_m | soil_wetness | dam_release_cumecs | rise_24h_m | flood_next_day |
|---|---|---|---|---|---|---|---|
2025-06-01 | 0.0 | 19.5 | 97.77 | 0.27 | 42.0 | 0.0 | 0 |
2025-06-02 | 56.0 | 3.8 | 97.55 | 0.55 | 0.0 | -0.22 | 0 |
2025-06-03 | 0.0 | 34.7 | 98.16 | 0.5 | 0.0 | 0.61 | 0 |
2025-06-04 | 0.0 | 0.3 | 97.28 | 0.45 | 0.0 | -0.88 | 0 |
6Step 5 — Data Understanding
Is the data collected representative of the problem to be solved?
The first finding is the imbalance: 60 of 1211 days were followed by a flood — 5.0 %. A model that never warned would be right on every calm day: 95.0 % accurate, and of no use to anyone (chart 2).
Chart 1 shows a single monsoon: the river spends most of the season well below danger and crosses it only in a few short spells. Chart 3 shows the flood days clustered where upstream rain is heavy and the river is already high — but also some floods after only moderate measured rain, where the unmeasured hill rain must have played a part.
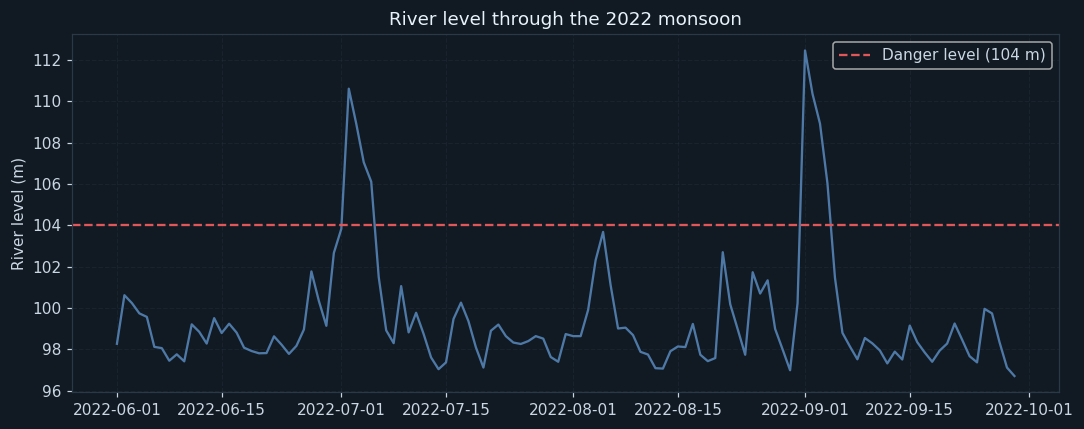
The river level each day of one monsoon, with the danger level dashed.
Most of the season the river is metres below danger; it crosses only in short spells after heavy rain. A warning system is about catching those few days, not the many calm ones.
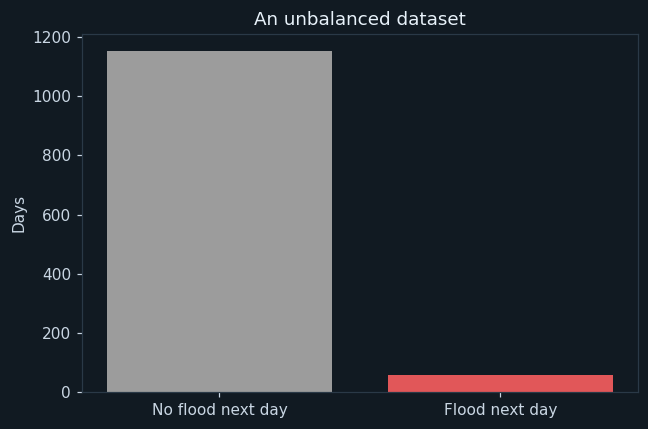
How many days were followed by no flood and by a flood.
Calm days outnumber flood days about nineteen to one. This chart is the reason the project cannot be judged on accuracy.
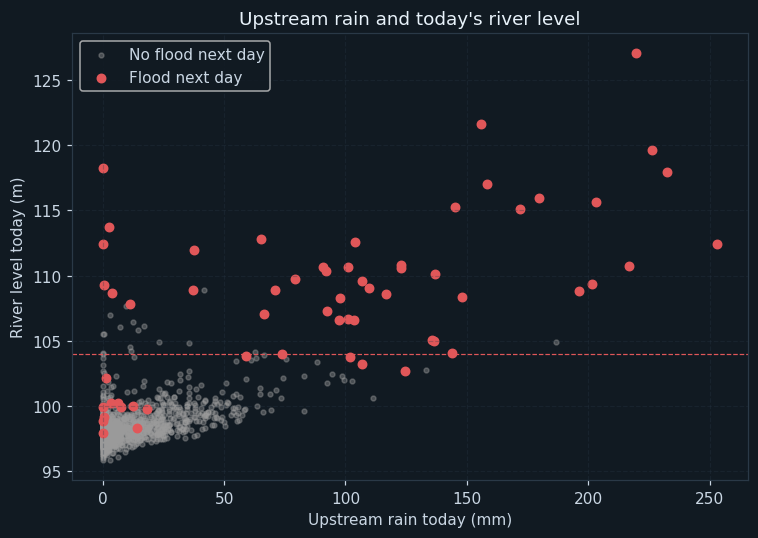
Each dot is a day: upstream rain across, today's river level up. Red dots were followed by a flood.
Floods follow days with heavy upstream rain and a river that is already high. But a few red dots sit at moderate rain — floods driven partly by rain no gauge recorded. Those are the ones any model will struggle with.
7Step 6 — Data Preparation
Removed by date, and the series sorted, so each day appears once and in order — essential for rolling totals.
Filled with the upstream gauge's reading for the same day, as the gauge reader suggested. On a stormy day, a seasonal average would badly understate the rain; the nearest gauge is a far better estimate.
Feature engineering
rain_3day_mm and upstream_3day_mm add up the last three days of rain, within each monsoon, because the gauge reader said floods follow two or three wet days, not one. Chart 4 confirms that three-day upstream rain separates flood and calm days well.
metres_below_danger is the gap between today's level and the 104 m danger mark — the same information as the level, but expressed as "how far there is to go", which is how the officer thinks about it.
With nine features, both models are trained.
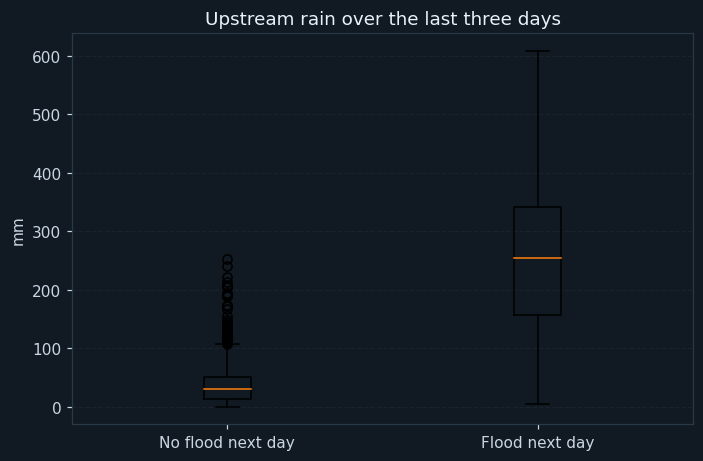
Three-day upstream rain for days followed by no flood and by a flood.
Before floods, three-day upstream rain is several times higher. The engineered feature separates the two classes far better than one day's rain alone.
8Step 7 — Modelling
Each day has a known outcome — flood the next day or not — so this is supervised binary classification.
Because the warning will be used on future monsoons, the test set is the two most recent monsoons, 2023 and 2024 (242 flood days : 11 days), and the models train on 2015–2022 (968 flood days : 49 days).
How the models work
Both models use class_weight="balanced". Without it, a model trained on nineteen calm days for every flood day learns that saying "no flood" is almost always right. Weighting makes each flood day count nineteen times as much, so missing one is costly to the model.
Logistic Regression, with its inputs scaled, gives a probability of a flood tomorrow. The Random Forest of 300 trees votes; its probability is the share of trees voting "flood".
9Step 8 — Evaluation
On 2023–2024, Logistic Regression's counts were 9 2 2 229 (TP, FN, FP, TN) — recall 0.818, precision 0.818; the Random Forest's were 9 2 1 230 — recall 0.818, precision 0.9. Both have accuracy near 98%, but so would a model that never warned: accuracy says nothing here.
With only eleven flood days in the test years, the scores are fragile, so the models were also checked with leave-one-year-out cross validation: each monsoon is held out in turn, and predicted by a model trained on the other nine. Days from the same monsoon never sit on both sides of a split. Pooling every held-out prediction, Logistic Regression caught floods with recall 0.967 and precision 0.659; the Random Forest with recall 0.917 and precision 0.859.
That is the real choice. Logistic Regression misses fewer floods; the Random Forest raises fewer false alarms and has the higher F1. The officer was clear that a missed flood is worse, so Logistic Regression is deployed — while its false alarms are watched, because warning fatigue is a real danger.
Two monsoons had no floods at all. Recall is undefined for them — there is nothing to catch — and the program reports that instead of scoring them as 0, which would wrongly drag the average down.
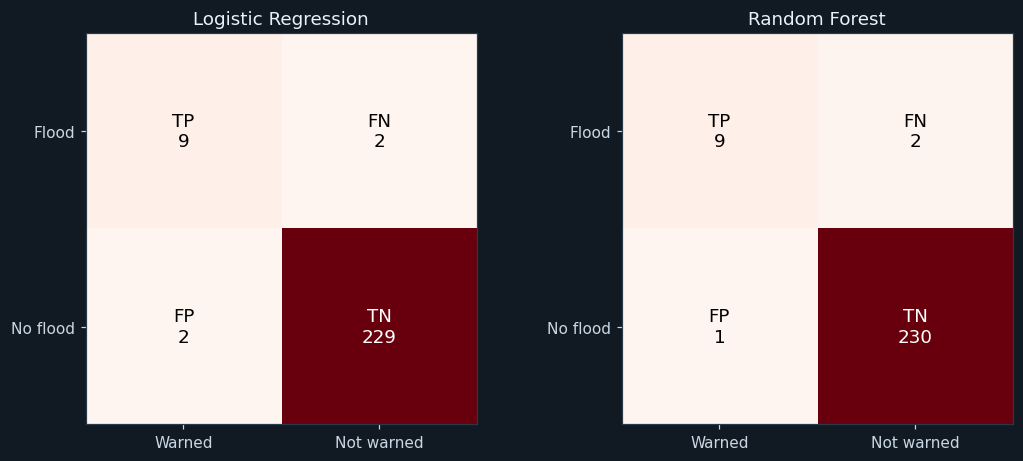
For each model on the two test monsoons: TP (flood warned of), FN (flood missed), FP (false alarm) and TN (calm day, no warning).
Both models catch the same number of floods; the Random Forest raises one false alarm fewer. With only 11 flood days in the test years, one day either way changes the scores a lot — which is why leave-one-year-out validation matters.
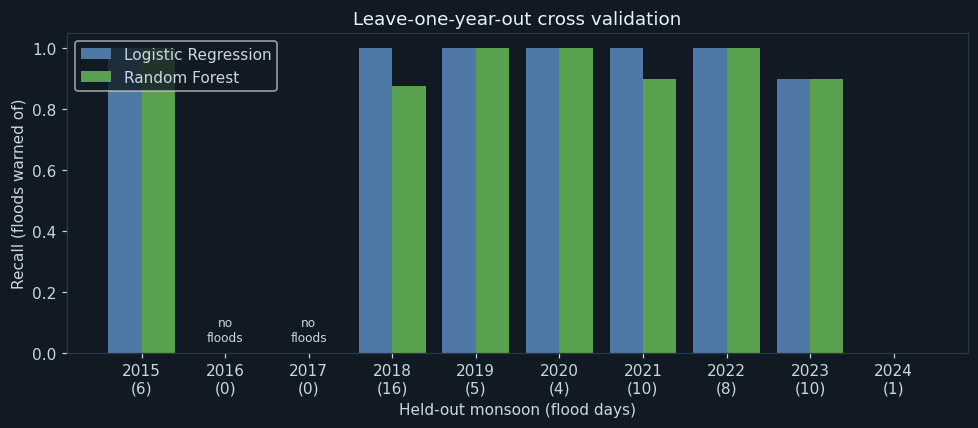
Recall in each held-out monsoon, with the number of flood days under each year. Two monsoons had no floods, so recall cannot be measured for them.
Most years every flood is caught. 2024 had a single flood, and both models missed it — a flood driven by unmeasured hill rain. Recall in a year with one flood is either 0 or 1, so the pooled figures are the fairer summary.
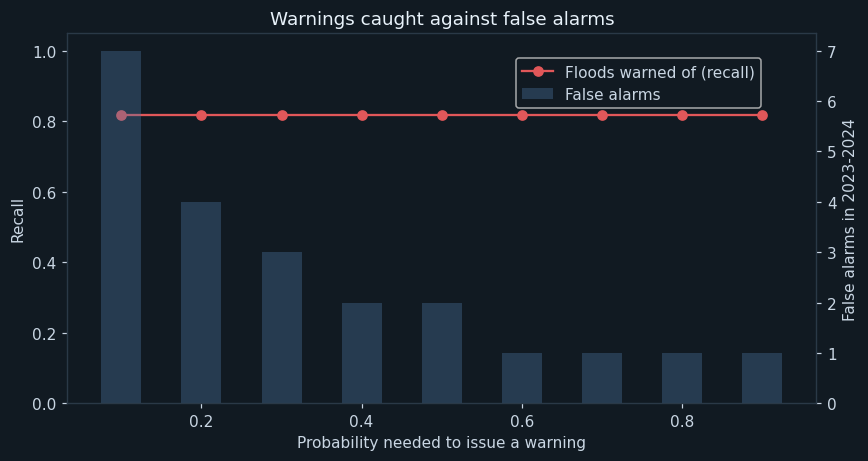
For Logistic Regression on 2023–2024: the share of floods warned of (red line) and the number of false alarms (blue bars) at each threshold.
A low threshold catches more floods but raises more false alarms; a high one the reverse. At 0.5 the balance is good for these monsoons, and the officer's limit on false alarms is met.
10Step 9 — Deployment
The chosen model is saved to flood_model.pkl. Each evening it would be given the day's readings; if tomorrow's flood probability is 0.5 or more, a warning is issued. The program shows two days: an ordinary monsoon day (no warning) and a day after three days of heavy rain with the river already high (warning).
As the panchayat member asked, the output is a clear yes/no warning sent by SMS to the panchayat and announced — with the probability kept for the officers.
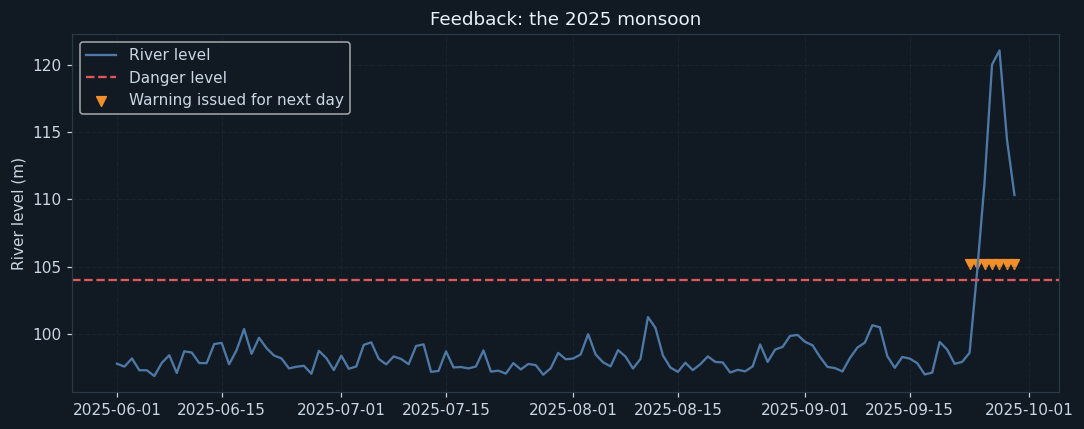
The river level through 2025, the danger level, and an orange marker on each evening a warning was issued for the next day.
The warnings fall just before each crossing of the danger level. Replaying a monsoon the model never saw is the most convincing test a warning system can get before real use.
11Step 10 — Feedback
The 2025 monsoon is replayed evening by evening. It had 7 flood days; the model had warned of 7 of them the evening before, with 0 false alarms.
One good monsoon does not prove the system: 2024 showed that a flood driven by unmeasured hill rain can be missed entirely. The feedback plan is to record, after every monsoon, every flood missed and every false alarm, and to look for their causes — a missed flood after hill rain is the strongest argument for installing a new rain gauge in those hills.
Feedback from villagers matters equally: if warnings arrive too late at night, or people stop responding after false alarms, the threshold and the way warnings are delivered must change.
12Ethical considerations
Recall was put first because a missed flood can kill. The model's known blind spot — floods from unmeasured rain — must be told to the authorities, so they do not rely on it alone.
Every false alarm makes the next warning less likely to be obeyed. Reporting false alarms alongside recall keeps that cost visible.
Warnings by SMS miss families without phones. The poorest households, often living closest to the river, must be reached by announcements and volunteers too.
The model advises; the district authority decides and is accountable for warnings. It should never be the only source.
13Source code
The whole program, laid out as the ten steps of the methodology. Every chart and number on this page came out of running it.
# ---------------------------------------------------------------------------
# flood_warning.py
#
# Capstone project: a next-day flood warning for a river town, from today's
# rain, upstream rain, river level, soil wetness and dam releases.
#
# CBSE Class XII, Artificial Intelligence (843), Part C - Capstone Project.
# SDG 13 (Climate Action) and SDG 11 (Sustainable Cities and Communities).
#
# Data Science Methodology, 10 steps. CLASSIFICATION of a RARE event: floods
# happen on a few days a year, so accuracy is useless and the project is
# judged on recall, precision and F1. Two models - Logistic Regression and a
# Random Forest, both told to weight the rare class - are tested on the two
# latest monsoons, and checked with leave-one-year-out cross validation.
#
# Libraries: pandas, numpy, matplotlib, scikit-learn, joblib.
# ---------------------------------------------------------------------------

# %% Step 1 - Business Understanding
print("=" * 64)
print("A FLOOD EARLY-WARNING MODEL")
print("=" * 64)
print("Problem : the river crosses its danger level with little warning")
print("Goal    : warn a day ahead, so people and cattle can move in time")
print()

# %% Step 2 - Analytic Approach
print("Analytic approach : predictive - classification of a rare event")
print()

# %% Step 3 - Data Requirements
import pandas as pd
import numpy as np
import matplotlib.pyplot as plt
from sklearn.pipeline import make_pipeline
from sklearn.preprocessing import StandardScaler
from sklearn.linear_model import LogisticRegression
from sklearn.ensemble import RandomForestClassifier
from sklearn.model_selection import LeaveOneGroupOut
from sklearn.metrics import confusion_matrix, precision_score, recall_score, f1_score, accuracy_score
import joblib

pd.set_option("display.width", 140)
pd.set_option("display.max_columns", 20)
DANGER = 104.0

# %% Step 4 - Data Collection
data = pd.read_csv("river_gauge.csv", parse_dates=["date"])
print("Days collected :", len(data))
print("Monsoons       :", data["date"].dt.year.min(), "to", data["date"].dt.year.max())
print(data.head(6))
print()

# %% Step 5 - Data Understanding
print("--- Step 5: Data Understanding ---")
print("Missing values:")
print(data.isnull().sum().to_string())
print()
floods = data["flood_next_day"].sum()
print("Days followed by a flood :", floods, "of", len(data))
print("Share of flood days      :", round(data["flood_next_day"].mean() * 100, 1), "%")
print("Accuracy of a model that NEVER warns :", round((1 - data["flood_next_day"].mean()) * 100, 1), "%")
print()

# Chart 1: one monsoon, with the danger level.
one = data[data["date"].dt.year == 2022]
plt.figure(figsize=(10, 4))
plt.plot(one["date"], one["river_level_m"], color="#4e79a7")
plt.axhline(DANGER, color="#e15759", linestyle="--", label="Danger level (104 m)")
plt.title("River level through the 2022 monsoon")
plt.ylabel("River level (m)")
plt.legend()
plt.grid(True, linestyle="--", alpha=0.3)
plt.tight_layout()
plt.savefig("chart1_season_2022.png")
plt.close()

# Chart 2: how rare floods are.
plt.figure(figsize=(6, 4))
plt.bar(["No flood next day", "Flood next day"], data["flood_next_day"].value_counts().sort_index(),
        color=["#9c9c9c", "#e15759"])
plt.title("An unbalanced dataset")
plt.ylabel("Days")
plt.tight_layout()
plt.savefig("chart2_balance.png")
plt.close()

# Chart 3: upstream rain against today's river level.
calm = data[data["flood_next_day"] == 0]
flood = data[data["flood_next_day"] == 1]
plt.figure(figsize=(7, 5))
plt.scatter(calm["upstream_rain_mm"], calm["river_level_m"], s=10, alpha=0.4, color="#9c9c9c", label="No flood next day")
plt.scatter(flood["upstream_rain_mm"], flood["river_level_m"], s=30, color="#e15759", label="Flood next day")
plt.axhline(DANGER, color="#e15759", linestyle="--", linewidth=0.8)
plt.title("Upstream rain and today's river level")
plt.xlabel("Upstream rain today (mm)")
plt.ylabel("River level today (m)")
plt.legend()
plt.grid(True, linestyle="--", alpha=0.3)
plt.tight_layout()
plt.savefig("chart3_upstream.png")
plt.close()

# %% Step 6 - Data Preparation
print("--- Step 6: Data Preparation ---")
before = len(data)
data = data.drop_duplicates(subset="date").sort_values("date").reset_index(drop=True)
print("Duplicate days removed      :", before - len(data))
data["rain_mm"] = pd.to_numeric(data["rain_mm"])
blank = data["rain_mm"].isnull().sum()
# A blank local rain reading is filled with that day's upstream rain, the
# nearest gauge - better than a seasonal average on a stormy day.
data["rain_mm"] = data["rain_mm"].fillna(data["upstream_rain_mm"])
print("Blank rain readings filled  :", blank, "(from the upstream gauge)")

# Feature engineering: rain over the last three days, and the gap between
# today's level and the danger mark.
data["year"] = data["date"].dt.year
data["rain_3day_mm"] = data.groupby("year")["rain_mm"].transform(lambda r: r.rolling(3, min_periods=1).sum())
data["upstream_3day_mm"] = data.groupby("year")["upstream_rain_mm"].transform(lambda r: r.rolling(3, min_periods=1).sum())
data["metres_below_danger"] = DANGER - data["river_level_m"]
features = ["rain_mm", "upstream_rain_mm", "rain_3day_mm", "upstream_3day_mm", "river_level_m",
            "rise_24h_m", "metres_below_danger", "soil_wetness", "dam_release_cumecs"]
print("Features used               :", len(features))
print()

# Chart 4: three-day upstream rain for flood and calm days.
plt.figure(figsize=(6.5, 4.3))
plt.boxplot([data[data["flood_next_day"] == 0]["upstream_3day_mm"], data[data["flood_next_day"] == 1]["upstream_3day_mm"]],
            labels=["No flood next day", "Flood next day"])
plt.title("Upstream rain over the last three days")
plt.ylabel("mm")
plt.grid(True, axis="y", linestyle="--", alpha=0.3)
plt.tight_layout()
plt.savefig("chart4_upstream_3day.png")
plt.close()

# %% Step 7 - Modelling
print("--- Step 7: Modelling ---")
# A warning system is used on future monsoons, so the test is the two
# latest monsoons, 2023 and 2024 - never mixed into training.
train = data[data["year"] <= 2022]
test = data[data["year"] >= 2023]
X_train, y_train = train[features], train["flood_next_day"]
X_test, y_test = test[features], test["flood_next_day"]
print("Training days (2015-2022) :", len(train), " flood days :", y_train.sum())
print("Testing days (2023-2024)  :", len(test), " flood days :", y_test.sum())

# class_weight="balanced" tells each model that a missed flood day counts
# as much as all the calm days together - otherwise it learns to say "no".
logistic = make_pipeline(StandardScaler(), LogisticRegression(class_weight="balanced", max_iter=2000))
forest = RandomForestClassifier(n_estimators=300, min_samples_leaf=3, class_weight="balanced", random_state=0)
logistic.fit(X_train, y_train)
forest.fit(X_train, y_train)
print()

# %% Step 8 - Evaluation
print("--- Step 8: Evaluation ---")
results = {}
for name, model in [["Logistic Regression", logistic], ["Random Forest", forest]]:
    pred = model.predict(X_test)
    tn, fp, fn, tp = confusion_matrix(y_test, pred).ravel()
    results[name] = pred
    print(name)
    print("  " + name + " TP, FN, FP, TN :", tp, fn, fp, tn)
    print("  " + name + " accuracy  :", round(accuracy_score(y_test, pred), 3))
    print("  " + name + " precision :", round(precision_score(y_test, pred, zero_division=0), 3))
    print("  " + name + " recall    :", round(recall_score(y_test, pred), 3))
    print("  " + name + " F1        :", round(f1_score(y_test, pred), 3))
print()

# Leave-one-year-out cross validation: each monsoon in turn is held out and
# predicted by a model trained on all the other monsoons. Days from the same
# season never sit on both sides of the split.
groups = data["year"]
logo = LeaveOneGroupOut()
pooled = {"Logistic Regression": np.zeros(len(data), dtype=int), "Random Forest": np.zeros(len(data), dtype=int)}
year_recall = {"Logistic Regression": [], "Random Forest": []}
years = []
year_floods = []
for tr, te in logo.split(data[features], data["flood_next_day"], groups):
    years.append(int(groups.iloc[te[0]]))
    yt = data["flood_next_day"].iloc[te]
    year_floods.append(int(yt.sum()))
    for name in pooled:
        if name == "Logistic Regression":
            m = make_pipeline(StandardScaler(), LogisticRegression(class_weight="balanced", max_iter=2000))
        else:
            m = RandomForestClassifier(n_estimators=300, min_samples_leaf=3, class_weight="balanced", random_state=0)
        m.fit(data[features].iloc[tr], data["flood_next_day"].iloc[tr])
        p = m.predict(data[features].iloc[te])
        pooled[name][te] = p
        # Recall is undefined for a monsoon with no floods: nothing to catch.
        year_recall[name].append(recall_score(yt, p) if yt.sum() > 0 else np.nan)
print("Leave-one-year-out recall for each held-out monsoon:")
print("  Year  Floods  Logistic  Forest")
for i in range(len(years)):
    if year_floods[i] == 0:
        print("  ", years[i], "    0     no floods to catch")
    else:
        print("  ", years[i], str(year_floods[i]).rjust(5), "   ", round(year_recall["Logistic Regression"][i], 2),
              "    ", round(year_recall["Random Forest"][i], 2))
# Pooled: every day's held-out prediction, from the model that never saw its monsoon.
y_all = data["flood_next_day"]
for name in pooled:
    print(name, "- pooled recall    :", round(recall_score(y_all, pooled[name]), 3))
    print(name, "- pooled precision :", round(precision_score(y_all, pooled[name]), 3))
    print(name, "- pooled F1        :", round(f1_score(y_all, pooled[name]), 3))
print()

# Chart 5: confusion matrices on 2023-2024.
plt.figure(figsize=(10, 4.3))
for k, name in enumerate(["Logistic Regression", "Random Forest"]):
    cm = confusion_matrix(y_test, results[name], labels=[1, 0])
    plt.subplot(1, 2, k + 1)
    plt.imshow(cm, cmap="Reds")
    labels = [["TP", "FN"], ["FP", "TN"]]
    for r in range(2):
        for c in range(2):
            plt.text(c, r, labels[r][c] + "\n" + str(cm[r][c]), ha="center", va="center", fontsize=12,
                     color="white" if cm[r][c] > cm.max() / 2 else "black")
    plt.xticks([0, 1], ["Warned", "Not warned"])
    plt.yticks([0, 1], ["Flood", "No flood"])
    plt.title(name)
plt.tight_layout()
plt.savefig("chart5_confusion.png")
plt.close()

# Chart 6: recall in each held-out year (years with no floods left blank).
x = np.arange(len(years))
plt.figure(figsize=(9, 4))
plt.bar(x - 0.2, np.nan_to_num(year_recall["Logistic Regression"]), width=0.4, color="#4e79a7", label="Logistic Regression")
plt.bar(x + 0.2, np.nan_to_num(year_recall["Random Forest"]), width=0.4, color="#59a14f", label="Random Forest")
for i in range(len(years)):
    if year_floods[i] == 0:
        plt.text(x[i], 0.04, "no\nfloods", ha="center", fontsize=8)
plt.xticks(x, [str(y) + "\n(" + str(f) + ")" for y, f in zip(years, year_floods)])
plt.ylim(0, 1.05)
plt.ylabel("Recall (floods warned of)")
plt.xlabel("Held-out monsoon (flood days)")
plt.title("Leave-one-year-out cross validation")
plt.legend()
plt.tight_layout()
plt.savefig("chart6_by_year.png")
plt.close()

# The threshold: Logistic Regression's probability, and how many floods
# are caught - and false alarms raised - at each level.
prob = logistic.predict_proba(X_test)[:, 1]
thresholds = np.round(np.arange(0.1, 0.91, 0.1), 1)
recalls = []
alarms = []
for t in thresholds:
    warn = prob >= t
    recalls.append(recall_score(y_test, warn))
    alarms.append(int((warn & (y_test == 0)).sum()))
chosen = 0.5
print("Threshold used                     :", chosen)
print("False alarms in two monsoons at 0.5 :", alarms[list(thresholds).index(chosen)])
print()

# Chart 7: floods caught and false alarms at each threshold.
fig, ax1 = plt.subplots(figsize=(8, 4.3))
ax1.plot(thresholds, recalls, marker="o", color="#e15759", label="Floods warned of (recall)")
ax1.set_ylabel("Recall")
ax1.set_ylim(0, 1.05)
ax1.set_xlabel("Probability needed to issue a warning")
ax2 = ax1.twinx()
ax2.bar(thresholds, alarms, width=0.05, alpha=0.35, color="#4e79a7", label="False alarms")
ax2.set_ylabel("False alarms in 2023-2024")
ax1.set_title("Warnings caught against false alarms")
fig.legend(loc="upper right", bbox_to_anchor=(0.88, 0.88))
fig.tight_layout()
plt.savefig("chart7_threshold.png")
plt.close()

# %% Step 9 - Deployment
print("--- Step 9: Deployment ---")
joblib.dump(logistic, "flood_model.pkl")
model = joblib.load("flood_model.pkl")
today = pd.DataFrame({
    "rain_mm": [12.0, 85.0], "upstream_rain_mm": [20.0, 140.0], "rain_3day_mm": [30.0, 190.0],
    "upstream_3day_mm": [45.0, 260.0], "river_level_m": [98.4, 102.9], "rise_24h_m": [0.1, 1.4],
    "metres_below_danger": [5.6, 1.1], "soil_wetness": [0.45, 0.95], "dam_release_cumecs": [0, 900],
})
p_today = model.predict_proba(today)[:, 1]
for i, label in enumerate(["An ordinary monsoon day", "After three days of heavy rain"]):
    action = "ISSUE FLOOD WARNING for tomorrow" if p_today[i] >= chosen else "no warning"
    print(label.ljust(32), "probability", round(p_today[i], 3), "->", action)
print()

# %% Step 10 - Feedback
print("--- Step 10: Feedback ---")
# The 2025 monsoon arrives. Each evening the model issues (or does not
# issue) a warning for the next day; afterwards the warnings are checked.
s25 = pd.read_csv("monsoon_2025.csv", parse_dates=["date"])
s25["year"] = 2025
s25["rain_3day_mm"] = s25["rain_mm"].rolling(3, min_periods=1).sum()
s25["upstream_3day_mm"] = s25["upstream_rain_mm"].rolling(3, min_periods=1).sum()
s25["metres_below_danger"] = DANGER - s25["river_level_m"]
warn25 = model.predict_proba(s25[features])[:, 1] >= chosen
flood25 = s25["flood_next_day"] == 1
print("Flood days in the 2025 monsoon      :", int(flood25.sum()))
print("Of these, warned the evening before :", int((warn25 & flood25).sum()))
print("False alarms in 2025                :", int((warn25 & ~flood25).sum()))
print("Recall in 2025                      :", round(recall_score(flood25, warn25), 3))

# Chart 8: the 2025 monsoon, warnings and floods.
plt.figure(figsize=(10, 4))
plt.plot(s25["date"], s25["river_level_m"], color="#4e79a7", label="River level")
plt.axhline(DANGER, color="#e15759", linestyle="--", label="Danger level")
warned_days = s25["date"][warn25]
plt.scatter(warned_days, [DANGER + 1.2] * len(warned_days), marker="v", color="#f28e2b", s=40, label="Warning issued for next day")
plt.title("Feedback: the 2025 monsoon")
plt.ylabel("River level (m)")
plt.legend(loc="upper left")
plt.grid(True, linestyle="--", alpha=0.3)
plt.tight_layout()
plt.savefig("chart8_monsoon_2025.png")
plt.close()
The library calls it is built from
| Call | Step | What it does |
|---|---|---|
pd.read_csv(parse_dates=["date"]) | Step 4 | Reads the daily records with real dates |
value_counts() / mean() | Step 5 | Measures how rare floods are |
fillna(data["upstream_rain_mm"]) | Step 6 | Fills a blank local reading from the upstream gauge |
groupby("year")[...].transform(rolling(3).sum()) | Step 6 | Three-day rain totals within each monsoon |
LogisticRegression(class_weight="balanced") | Step 7 | Weights the rare flood days |
RandomForestClassifier(class_weight="balanced") | Step 7 | The forest, with the same weighting |
LeaveOneGroupOut() with groups = year | Step 8 | Leave-one-year-out cross validation |
precision_score / recall_score / f1_score | Step 8 | The metrics that matter for a rare event |
predict_proba() >= threshold | Steps 8–10 | Turns a probability into a warning |
joblib.dump() / load() | Step 9 | Saves and reloads the model |
14Output of a real run
================================================================
A FLOOD EARLY-WARNING MODEL
================================================================
Problem : the river crosses its danger level with little warning
Goal    : warn a day ahead, so people and cattle can move in time

Analytic approach : predictive - classification of a rare event

Days collected : 1211
Monsoons       : 2015 to 2024
        date  rain_mm  upstream_rain_mm  river_level_m  soil_wetness  dam_release_cumecs  rise_24h_m  flood_next_day
0 2015-06-01      0.0              13.9          97.14          0.27                 0.0        0.00               0
1 2015-06-02      0.0               0.0          97.71          0.24                15.0        0.57               0
2 2015-06-03      0.0               0.0          96.60          0.22                 0.0       -1.11               0
3 2015-06-04      3.9               0.3          96.83          0.22                 0.0        0.23               0
4 2015-06-05     11.1               3.9          97.18          0.26                 0.0        0.35               0
5 2015-06-06      0.0               4.7          98.38          0.23                 0.0        1.20               0

--- Step 5: Data Understanding ---
Missing values:
date                  0
rain_mm               8
upstream_rain_mm      0
river_level_m         0
soil_wetness          0
dam_release_cumecs    0
rise_24h_m            0
flood_next_day        0

Days followed by a flood : 60 of 1211
Share of flood days      : 5.0 %
Accuracy of a model that NEVER warns : 95.0 %

--- Step 6: Data Preparation ---
Duplicate days removed      : 1
Blank rain readings filled  : 8 (from the upstream gauge)
Features used               : 9

--- Step 7: Modelling ---
Training days (2015-2022) : 968  flood days : 49
Testing days (2023-2024)  : 242  flood days : 11

--- Step 8: Evaluation ---
Logistic Regression
  Logistic Regression TP, FN, FP, TN : 9 2 2 229
  Logistic Regression accuracy  : 0.983
  Logistic Regression precision : 0.818
  Logistic Regression recall    : 0.818
  Logistic Regression F1        : 0.818
Random Forest
  Random Forest TP, FN, FP, TN : 9 2 1 230
  Random Forest accuracy  : 0.988
  Random Forest precision : 0.9
  Random Forest recall    : 0.818
  Random Forest F1        : 0.857

Leave-one-year-out recall for each held-out monsoon:
  Year  Floods  Logistic  Forest
   2015     6     1.0      1.0
   2016     0     no floods to catch
   2017     0     no floods to catch
   2018    16     1.0      0.88
   2019     5     1.0      1.0
   2020     4     1.0      1.0
   2021    10     1.0      0.9
   2022     8     1.0      1.0
   2023    10     0.9      0.9
   2024     1     0.0      0.0
Logistic Regression - pooled recall    : 0.967
Logistic Regression - pooled precision : 0.659
Logistic Regression - pooled F1        : 0.784
Random Forest - pooled recall    : 0.917
Random Forest - pooled precision : 0.859
Random Forest - pooled F1        : 0.887

Threshold used                     : 0.5
False alarms in two monsoons at 0.5 : 2

--- Step 9: Deployment ---
An ordinary monsoon day          probability 0.0 -> no warning
After three days of heavy rain   probability 0.995 -> ISSUE FLOOD WARNING for tomorrow

--- Step 10: Feedback ---
Flood days in the 2025 monsoon      : 7
Of these, warned the evening before : 7
False alarms in 2025                : 0
Recall in 2025 : 1.015The same project in Orange
The same classifiers and class balancing are available in Orange's widgets. The tool is Orange Data Mining.
| Widget | What it does |
|---|---|
| File | Load river_gauge.csv; set flood_next_day as the target (categorical). |
| Feature Constructor | Add the three-day rain totals and metres below danger. |
| Select Rows | Split by year: 2015–2022 for training, 2023–2024 for testing. |
| Logistic Regression and Random Forest | In each, tick the option to balance the class distribution. |
| Test and Score | Test on test data; read precision, recall and F1 for class 1 — not just CA. |
| Confusion Matrix | Count floods missed and false alarms. |
16Testing
Every case was run: each gives the whole program a small input of its own.
| Test case | Expected | Actual | Result |
|---|---|---|---|
| Ten monsoons of days | Days collected : 1211 | Days collected : 1211 | Pass |
| A model that never warns would look 95% accurate | Accuracy of a model that NEVER warns : 95.0 % | Accuracy of a model that NEVER warns : 95.0 % | Pass |
| A monsoon with no floods is reported, not scored as 0 recall | 2016 0 no floods to catch | 2016 0 no floods to catch | Pass |
| Pooled across all held-out years, Logistic Regression misses few floods | Logistic Regression - pooled recall : 0.967 | Logistic Regression - pooled recall : 0.967 | Pass |
| Blank rain readings are filled from the upstream gauge | Blank rain readings filled : 8 (from the upstream gauge) | Blank rain readings filled : 8 (from the upstream gauge) | Pass |
| Floods that always follow very wet days: every flood warned of | Logistic Regression recall : 1.0 | Logistic Regression recall : 1.0 | Pass |
| Three blank rain readings are filled, none dropped | Blank rain readings filled : 3 (from the upstream gauge) | Blank rain readings filled : 3 (from the upstream gauge) | Pass |
| The data file is missing | FileNotFoundError: [Errno 2] No such file or directory: 'river_gauge.csv' | FileNotFoundError: [Errno 2] No such file or directory: 'river_gauge.csv' | Pass |
17Team roles and timeline
A capstone is done by a group of 3 to 5. A suggested split of the work, and a timeline across the year:
| Role | Responsible for |
|---|---|
| Project lead | Business understanding; interviews with officers, gauge readers and villagers |
| Data lead | River, rain and dam data; joining them by date |
| Analyst | Data understanding; the imbalance analysis; engineered features |
| Modeller | The balanced models, leave-one-year-out validation and the threshold |
| Documentation and outreach | The report, the 2025 replay, how warnings reach people, and the video |
| When | Methodology steps | Deliverable |
|---|---|---|
| April – May | 1 Business Understanding, 2 Analytic Approach | Problem statement; interviews before the monsoon |
| June – July | 3 Data Requirements, 4 Data Collection | Ten monsoons of data collected |
| August | 5 Data Understanding, 6 Data Preparation | Imbalance measured; features engineered |
| September – October | 7 Modelling, 8 Evaluation | Models compared year by year |
| November | 9 Deployment, 10 Feedback | The latest monsoon replayed |
| December – January | Documentation and video | Report and 3-minute video |
18Results, limits and what next
- Floods follow 5.0 % of monsoon days; a model that never warns would be 95.0 % accurate and useless.
- Pooled over ten held-out monsoons, Logistic Regression caught floods with recall 0.967, the Random Forest with 0.917 but fewer false alarms.
- Three-day upstream rain, a high river and wet ground are the warning signs.
- Floods driven by rain in ungauged hills can be missed entirely — the 2024 flood was.
- Replayed on the 2025 monsoon, the model warned of 7 of 7 floods the evening before.
Limitations
- Sample data for one imaginary gauge
- Few flood days — a few dozen in ten years — so every score is uncertain
- Cannot see rain that no gauge records
- One day ahead only, at one station
Future scope
- Add rainfall estimates from satellites or radar to cover ungauged hills
- Forecast two or three days ahead, with the meteorological department's rain forecast as a feature
- Extend to several gauge stations along the river
- Design how warnings reach households without phones
What the team had to learn
- Why accuracy misleads on unbalanced data, and what to use instead
- class_weight="balanced" in scikit-learn
- Leave-one-group-out cross validation, and why recall is undefined when there are no positives
- Rolling-window features with pandas
- Disaster warning systems and how they reach people
19Conclusion
The capstone built a next-day flood warning that, across ten held-out monsoons, catches almost every flood. Its most important lesson came before any model: for a rare event, a 95%-accurate model can be worthless, and the methodology's evaluation step must use recall, precision and F1.
Choosing between the models was a choice between two kinds of harm — missed floods and false alarms. Putting the officer's priorities into the decision, not just the numbers, is what turns a model into a warning system.
The model's limit is clear: rain that no gauge measures. The 2024 flood it missed is the best argument for better data — a new rain gauge in the hills would do more for the warning than any change to the model.
20The 3-minute video script
Part C asks for a video of exactly three minutes with six parts. A script, timed to the second:
| Time | Part | What to say and show |
|---|---|---|
| 0:00 – 0:25 | a. Problem statement | Show a flooded village. "Rivers rise overnight, and many towns get no warning. A day's notice saves lives." |
| 0:25 – 0:40 | b. SDG alignment | SDG 13 and SDG 11 icons. "Resilience to climate disasters, and fewer lives lost to them." |
| 0:40 – 1:15 | c. AI concepts and algorithms | "Predictive classification of a rare event. Logistic Regression and a Random Forest with balanced class weights, judged on recall and false alarms, validated one monsoon at a time." |
| 1:15 – 2:15 | d. How it works | Chart 2 — 'a model that never warns is 95% accurate'. Then the features, the year-by-year validation, and the 2025 replay with warnings before each flood. |
| 2:15 – 2:45 | e. Conclusion | "Almost every flood warned of a day ahead — except floods from rain no gauge measures. Better data is the next step." |
| 2:45 – 3:00 | f. Acknowledgement | "We thank our AI teacher, [name], and the officers and villagers who spoke to us." |
21Questions for the viva
▸Why is accuracy useless for your project?
Floods happen on about 5% of days, so a model that never warns is 95% accurate but catches no floods.
▸What does class_weight="balanced" do?
It makes each flood day count as much as many calm days, so the model is penalised heavily for missing floods.
▸What is leave-one-year-out cross validation?
Each monsoon is held out in turn and predicted by a model trained on the other monsoons, so days from the same season never appear on both sides.
▸Why did you pool the predictions instead of averaging recall per year?
Two years had no floods, so recall was undefined, and a year with one flood gives recall of only 0 or 1. Pooling every held-out prediction gives a fairer figure.
▸Why did you choose Logistic Regression over the Random Forest?
It missed fewer floods (higher recall). The forest had fewer false alarms, but a missed flood is the worse error.
▸Why did the model miss the 2024 flood?
It was caused partly by rain in hills with no gauge, which the model never sees.
▸Why fill blank rain readings from the upstream gauge?
On a stormy day the nearest gauge is a much better estimate than a seasonal average.
▸Which SDGs does it align to?
SDG 13, Climate Action (target 13.1), and SDG 11, Sustainable Cities and Communities (target 11.5).
22References
- Central Water Commission, Government of India — flood forecasting — https://cwc.gov.in/
- India Meteorological Department — rainfall and heavy-rain warnings — https://mausam.imd.gov.in/
- National Disaster Management Authority — Guidelines on Management of Floods — https://ndma.gov.in/
- scikit-learn: class_weight and LeaveOneGroupOut — https://scikit-learn.org/stable/
- CBSE, Artificial Intelligence (Subject Code 843), Class XII curriculum, 2026-27 — Part C
- CBSE, Artificial Intelligence Student Handbook, Class XII — Unit 2, Data Science Methodology
- Rollins, J. B. (2015). Foundational Methodology for Data Science. IBM Analytics.
- scikit-learn — https://scikit-learn.org/stable/; pandas, NumPy and Matplotlib documentation
- LambdaLab — https://www.lambdalab.in