Is This Water Safe to Drink?
A field-kit test in the morning, a lab verdict two days later — this capstone predicts the verdict on the spot, and makes the Unit 1 topic of missing values the heart of the project by comparing four ways of handling them.
1Introduction
A village tests its drinking-water sources with a field kit: pH, dissolved solids, turbidity, nitrate, fluoride, chloride and residual chlorine, read on the spot. But whether the water is safe is decided by the district laboratory, which also tests for bacteria such as E. coli — and that verdict arrives two days later.
For those two days, families keep drinking from every source, including the ones the lab will condemn. Field kits are not always complete either: the fluoride reagent runs out, a reading is skipped, and the data arrives with gaps.
This capstone asks whether the field readings alone can predict the laboratory's verdict well enough to warn people the same day — and treats the gaps in the data not as a nuisance but as a central decision of the project.
Clean Water and Sanitation
Good Health and Well-being
SDG target 6.1 is safe and affordable drinking water for all. Under the Jal Jeevan Mission, women in villages are trained to test water sources with field kits, but the decisive laboratory test — including for E. coli bacteria — takes two days, and people keep drinking in the meantime. Flagging likely-unsafe sources the same day protects families from diarrhoea and other water-borne disease, which is SDG 3.
2Step 1 — Business Understanding
What is the problem that you are trying to solve? The handbook uses the 5W1H Problem Canvas for this step.
- • Families drinking from hand pumps, wells, ponds and taps
- • Women trained to test water with field kits
- • District water-quality laboratories
- • The lab verdict takes two days
- • Field data has gaps when a test is skipped
- • Rural drinking-water sources of all kinds
- • The day a source is tested — especially after the monsoon, when contamination rises
- • Same-day warnings prevent water-borne disease
- • Labs can test the most suspicious samples first
- • Learn from past samples with both field readings and lab verdicts
- • Predict the verdict from field readings, even when some are missing
Problem statement
Who would use it: Village water and sanitation committees and the trained women who test sources with field kits; district water-quality laboratories deciding which samples to test first.
Talking to the stakeholders
The handbook pairs the 5W1H canvas with Design Thinking, which begins by empathising with the people who have the problem. The questions asked, and what each answer changed:
| Question asked | What we learned, and what it changed |
|---|---|
| To a field-kit tester: which tests do you skip, and why? | Fluoride most often — the reagent runs out first. That predicted the biggest gap in the data, and made missing values a central question. |
| To the same tester: what do people do while waiting for the lab? | Keep using the source. That is the whole cost of the two-day wait, and the reason the project exists. |
| To a lab chemist: what makes a sample fail? | Any limit of IS 10500 broken, or E. coli found. The label follows that standard — and E. coli cannot be read in the field, so the model must infer it. |
| To the chemist: what hints at bacteria before the test? | Cloudy water, no residual chlorine, and open sources like ponds and open wells. Those became the features the model was expected to lean on. |
| To a committee member: which mistake would be worse? | Calling a bad source safe — people get sick. Calling a good source unsafe just means boiling water until the lab confirms. Recall for unsafe water became the main metric. |
| To a district engineer: does the season matter? | After the monsoon, far more sources fail. The Feedback step was planned around monsoon samples. |
How it is handled today
Reliable, but two days late, and the lab can handle only so many samples.
Comparing each field reading with its IS 10500 limit catches chemical problems, but not bacteria — the most common cause of illness.
Safe advice, but not followed consistently, and it does nothing about fluoride or nitrate.
Objectives
- To scope same-day water-safety warnings with the 5W1H canvas
- To collect and understand field-kit readings with their lab verdicts
- To compare four ways of handling missing readings with stratified 5-fold cross validation
- To train a Random Forest classifier and tune its threshold so few unsafe sources are missed
- To deploy the model for new samples, including ones with tests missing
- To check, with post-monsoon samples, whether the model still works when contamination rises
3Step 2 — Analytic Approach
The question is whether a sample will pass or fail the laboratory test — a prediction of a category from measurements, so predictive analytics with binary classification.
Deciding what to do with a flagged source — warn, boil, send to the lab first — is the prescriptive step that follows, and the threshold chosen in Step 8 encodes it.
| Candidate | Why it was considered |
|---|---|
| Random Forest Classifier | Handles curved effects and interactions — such as turbidity mattering more for open sources — and reports which readings it relied on. |
| Rule check against IS 10500 limits | Catches chemical failures exactly, but cannot see bacteria; the model must do better than the rules alone. |
| Missing-value strategies | Not models but data decisions: drop rows, fill with the mean, fill with the median, or the median plus a 'was missing' indicator — compared in Step 6. |
4Step 3 — Data Requirements
The model needs past samples with both the field-kit readings and the laboratory verdict for the same source. Every kind of source — piped supply, hand pump, tube well, open well, pond — must be represented, because the risk differs so much between them.
The data will be incomplete, and the requirement is to record a skipped test as blank — never as zero, which would look like a real, very low reading.
| Data needed | Type | Format | Source |
|---|---|---|---|
| Kind of source | Categorical | Piped / hand pump / tube well / open well / pond | Field tester |
| pH, TDS, turbidity | Numeric | pH units; mg/L; NTU | Field test kit |
| Nitrate, fluoride, chloride | Numeric (may be blank) | mg/L | Field test kit |
| Residual chlorine | Numeric | mg/L | Field test kit |
| Laboratory verdict (label) | Categorical | Safe / Unsafe, per IS 10500 including E. coli | District water-quality laboratory |
5Step 4 — Data Collection
The field readings are primary data collected by trained testers; the verdicts come from the district laboratory. The Jal Jeevan Mission's Water Quality Management Information System records both, and much of it is public at district level.
The sample file, water_samples.csv, holds 1203 samples. monsoon_samples.csv holds 250 samples from after the monsoon, used only for feedback.
The verdicts follow IS 10500:2012, the Indian standard for drinking water: unsafe if pH is outside 6.5–8.5, dissolved solids exceed 2000 mg/L, turbidity exceeds 5 NTU, nitrate exceeds 45 mg/L, fluoride exceeds 1.5 mg/L, chloride exceeds 1000 mg/L, or E. coli is detected. E. coli is not in the field data — the model must infer it.
| Column | Type | What it holds | Role |
|---|---|---|---|
sample_id | text | An ID for the sample | not used |
source | text | Piped supply, Hand pump, Tube well, Open well or Pond | feature (one-hot) |
ph | decimal | pH | feature |
tds_mg_l | decimal | Total dissolved solids, mg/L | feature |
turbidity_ntu | decimal | Turbidity (cloudiness), NTU; sometimes blank | feature |
nitrate_mg_l | decimal | Nitrate, mg/L; sometimes blank | feature |
fluoride_mg_l | decimal | Fluoride, mg/L; often blank | feature |
chloride_mg_l | decimal | Chloride, mg/L | feature |
residual_chlorine_mg_l | decimal | Chlorine left from disinfection, mg/L | feature |
verdict | text | The laboratory's verdict, Safe or Unsafe | target (Unsafe = 1) |
water_samples.csv — Field-kit readings with the lab's verdict, including the gaps real field data has. 1,203 rows, 66.8 KB. Download the file
monsoon_samples.csv — Post-monsoon samples, used only for feedback. 250 rows, 14.4 KB. Download the file
The first eight rows of water_samples.csv
| sample_id | source | ph | tds_mg_l | turbidity_ntu | nitrate_mg_l | fluoride_mg_l | chloride_mg_l | residual_chlorine_mg_l | verdict |
|---|---|---|---|---|---|---|---|---|---|
W70001 | Open well | 7.33 | 298.0 | 3.7 | 38.6 | 0.62 | 43.0 | 0.0 | Safe |
W70002 | Tube well | 8.07 | 409.0 | 0.8 | 5.3 | 0.88 | 99.0 | 0.0 | Safe |
W70003 | Piped supply | 7.23 | 500.0 | 0.3 | 9.5 | 0.96 | 140.0 | 0.48 | Safe |
W70004 | Tube well | 7.78 | 638.0 | 0.6 | | | 202.0 | 0.0 | Safe |
W70005 | Hand pump | 8.08 | 390.0 | 4.9 | 33.2 | | 119.0 | 0.0 | Unsafe |
W70006 | Open well | 7.95 | 319.0 | 1.7 | 34.1 | 0.41 | 93.0 | 0.0 | Safe |
W70007 | Piped supply | 6.84 | 109.0 | 1.3 | 11.2 | | 64.0 | 0.13 | Safe |
W70008 | Hand pump | 6.75 | 1054.0 | 2.4 | 18.9 | 0.43 | 256.0 | 0.0 | Safe |
The first four rows of monsoon_samples.csv
| sample_id | source | ph | tds_mg_l | turbidity_ntu | nitrate_mg_l | fluoride_mg_l | chloride_mg_l | residual_chlorine_mg_l | verdict |
|---|---|---|---|---|---|---|---|---|---|
M80001 | Open well | 6.55 | 496.0 | 9.1 | 46.1 | 0.33 | 141.0 | 0.0 | Unsafe |
M80002 | Hand pump | 7.08 | 826.0 | 1.2 | 55.1 | 0.96 | 247.0 | 0.0 | Unsafe |
M80003 | Piped supply | 7.18 | 903.0 | 0.5 | 6.5 | 0.31 | 238.0 | 0.25 | Safe |
M80004 | Hand pump | 7.77 | 494.0 | 7.9 | 15.4 | 0.24 | 157.0 | 0.0 | Unsafe |
6Step 5 — Data Understanding
Is the data collected representative of the problem to be solved?
The first check is the gaps: fluoride is missing in about a fifth of samples, nitrate in a tenth, turbidity in one in twenty (chart 1). Dropping every row with any gap would lose a third of the data — which is why missing values become the main preparation decision.
39.6 % of samples failed the lab test, and the share varies enormously by source (chart 2): about one in ten piped supplies, but four in five open wells and ponds. Chart 3 shows turbidity is far higher in unsafe samples — the clue the chemist said hints at bacteria.
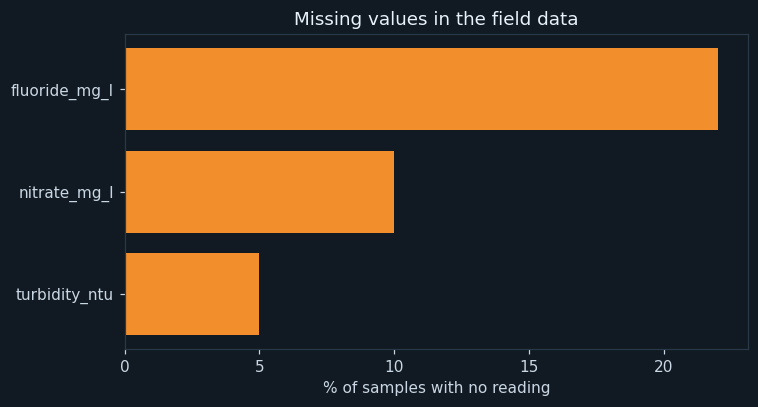
The percentage of samples with no reading, for each column that has gaps.
Fluoride is missing most often — just as the field tester said, the reagent runs out first. Every row missing any of the three would be lost if gaps were simply dropped.
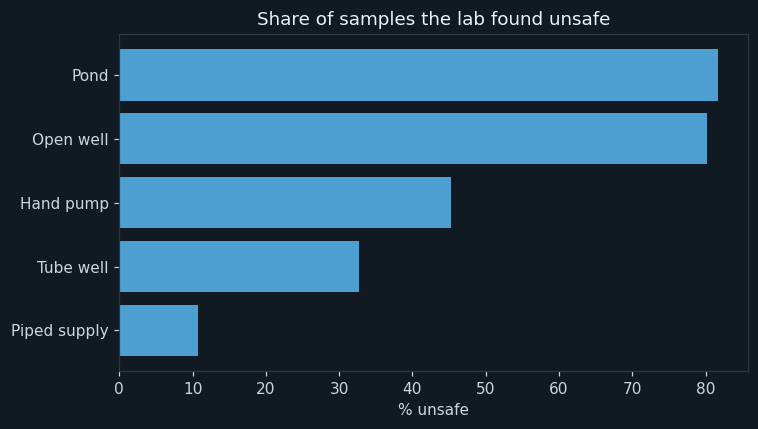
For each kind of source, the percentage of samples the laboratory found unsafe.
Piped, chlorinated supply is rarely unsafe; open wells and ponds usually are. The source alone is a strong clue — which is why it is a feature — but the model still has to tell good wells from bad ones.
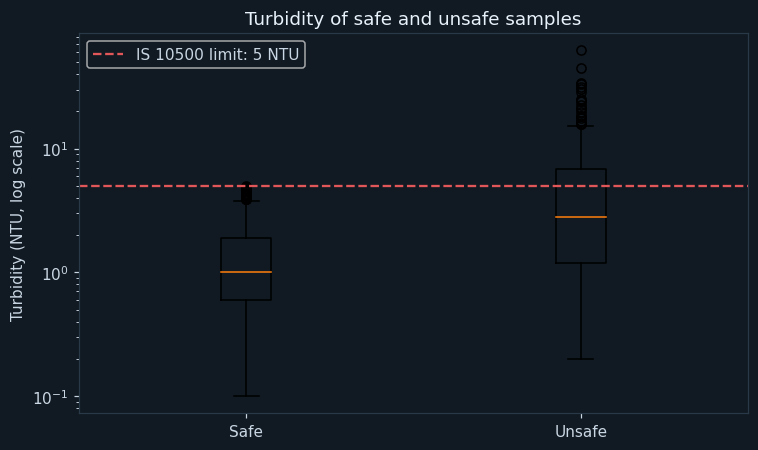
Turbidity for safe and unsafe samples, on a logarithmic scale (each step up is ten times cloudier). The dashed line is the IS 10500 limit of 5 NTU.
Unsafe samples are far cloudier. Many lie above the 5 NTU limit and fail for that reason alone; but many unsafe samples are below it — they failed for bacteria, and cloudiness is only a hint. The model must use the hint without the rule.
7Step 6 — Data Preparation
Removed, so no sample appears in both the training and the test data.
Four strategies were compared with stratified 5-fold cross validation (chart 4): A, drop every row with a gap; B, fill with the column mean; C, fill with the median; D, the median plus a column recording that the reading was missing. In B, C and D the filling is done inside a pipeline, so it is learned from the training folds only.
Dropping gaps scored highest, but on only the complete rows — a smaller, easier set. Worse, a deployed model cannot refuse every sample with a skipped test: a third of real samples would get no prediction at all. Its score answers a different question.
B, C and D scored almost the same, and the 'was missing' columns added nothing here. The simplest — C, the median, which extreme readings do not pull — was chosen. When methods tie, prefer the simpler one.
Feature engineering
The source is one-hot encoded into five columns. The kind of source is one of the strongest pieces of information: an open well is a very different risk from a chlorinated tap.
The Unsafe verdict becomes the target, unsafe = 1, so that precision and recall are about finding unsafe water — the class that matters.
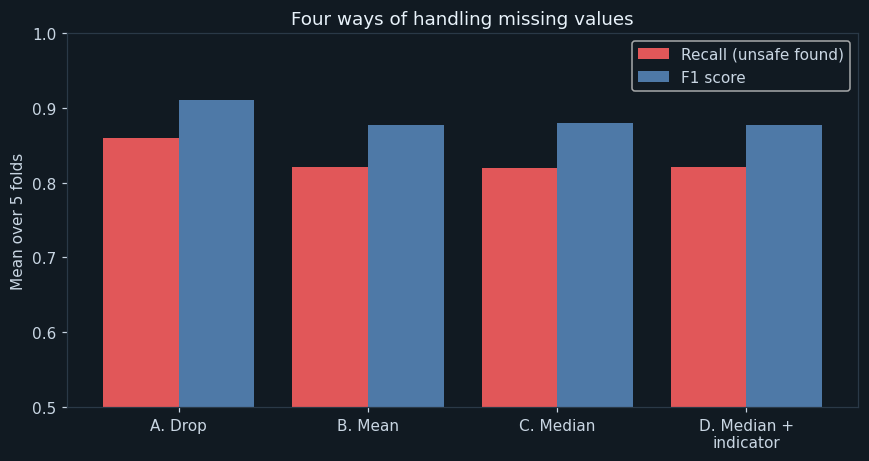
Mean recall and F1 score over five stratified folds for each strategy.
Dropping rows (A) appears best — but it was scored on only the complete rows, and could not be used on a third of real samples. Mean, median and median-plus-indicator (B, C, D) are almost identical. The lesson is as much about reading a comparison carefully as about the numbers.
8Step 7 — Modelling
Every training sample has a lab verdict — the label — so this is supervised learning; Safe/Unsafe makes it binary classification.
The split is stratified: 960 Testing samples : 240 samples for training and 240 for testing, each with the same share of unsafe water.
How the models work
The model is a pipeline of two steps: a SimpleImputer that fills each missing reading with the median learned from the training data, then a Random Forest of 300 trees. Because the imputer is inside the pipeline, new samples with missing readings are filled in exactly the same way when the model is deployed.
Each tree asks questions such as "is turbidity above 5?" or "is this an open well?", and the forest's probability is the share of trees voting Unsafe.
9Step 8 — Evaluation
At the default threshold of 0.5, the test counts were 76 19 2 143 (TP, FN, FP, TN): accuracy 0.912, precision 0.974, recall 0.8, F1 0.879. Stratified 5-fold cross validation gave similar recall in every fold, so the result is not a lucky split.
The committee member's answer decides the metric: a missed unsafe source makes people ill; a false alarm only means boiling water until the lab confirms. So the threshold is lowered to 0.3. Recall rises to 0.874 and precision falls to 0.847 — 12 of 95 unsafe test sources are now missed.
Those that are still missed are mostly bacterial contamination in water that looks normal in every field reading. No model can see what the field kit does not measure; the honest conclusion is that the model is a same-day warning, not a replacement for the lab.
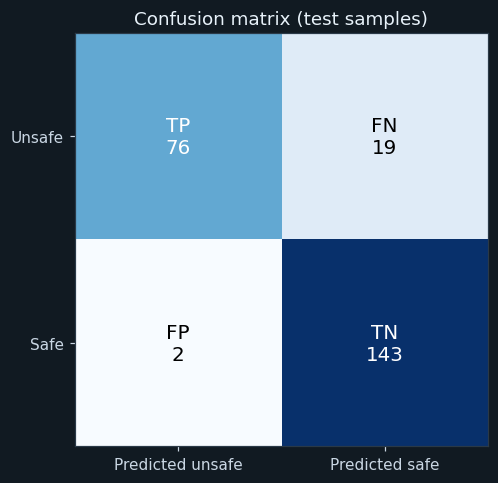
Test samples at the default threshold of 0.5: TP (unsafe, flagged), FN (unsafe, missed), FP (safe, flagged), TN (safe, cleared).
The model almost never calls safe water unsafe (very few false positives), but it misses some unsafe sources — the false negatives. Those are mostly bacterial contamination with nothing unusual in the chemistry, which the field kit cannot see directly.
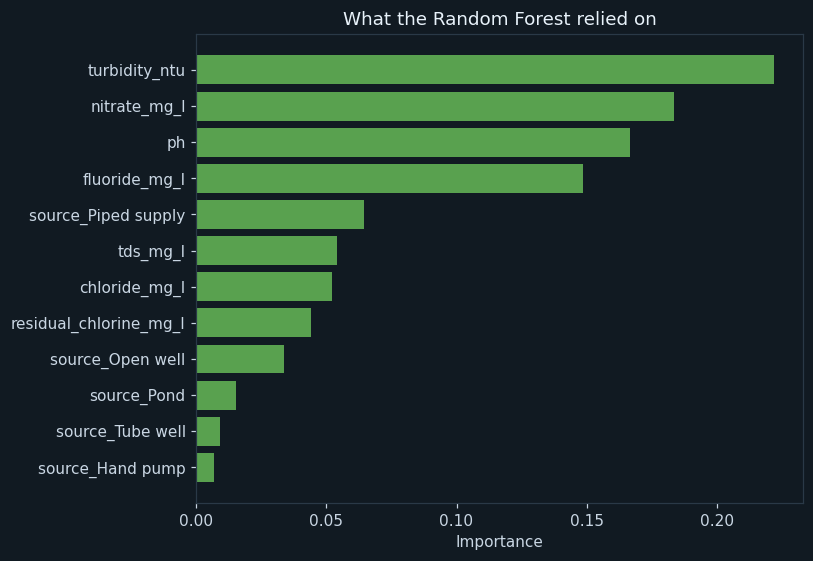
The importance of each feature in the forest's decisions.
Turbidity, nitrate, pH and fluoride matter most — the readings that break IS 10500 limits directly, and turbidity also as the hint of bacteria. Residual chlorine and the kind of source matter too: chlorinated piped water is the safest.
10Step 9 — Deployment
The pipeline is saved to water_model.pkl. The program checks three new samples — a chlorinated piped supply, a hand pump whose fluoride was not tested, and a cloudy open well whose nitrate was not tested. The missing readings are filled by the pipeline itself, and each sample gets a probability and an action.
In the field, the tester would enter the readings on a phone; a likely-unsafe source would be marked immediately with a warning to boil water, and its sample sent to the front of the lab's queue. The lab verdict still decides.
11Step 10 — Feedback
After the monsoon, 250 more sources were tested. Contamination rose sharply — 52.4 % of samples were unsafe, against 39.6 % before.
Recall on the monsoon samples was 0.931, against 0.874 on the original test set, so the model holds up. It does slightly better after the monsoon because more of the contamination comes with cloudy water, which the field kit does measure.
That is not a reason to stop checking. A different season — or a new contaminant such as arsenic in some districts — could break the model, and the lab results that keep arriving are exactly the feedback needed to catch it.
12Ethical considerations
A false 'safe' can make a family ill. The threshold was set for recall, and every flagged source still goes to the lab — the model warns early but never clears a source on its own.
Communities relying on ponds and open wells face the highest risk and often the least testing. Prioritising their samples is the fair use of the model.
The model cannot see bacteria. Telling users plainly that a 'likely safe' result still needs the lab test prevents false reassurance.
Recording a skipped test as 0 instead of blank would look like perfect water. The data requirements insist on blanks, and the testers must be trained to record them.
13Source code
The whole program, laid out as the ten steps of the methodology. Every chart and number on this page came out of running it.
# ---------------------------------------------------------------------------
# safe_water.py
#
# Capstone project: predicting, from a quick field-kit test, whether a
# drinking-water source will fail the laboratory's safety test - so unsafe
# sources can be flagged the same day instead of two days later.
#
# CBSE Class XII, Artificial Intelligence (843), Part C - Capstone Project.
# SDG 6 (Clean Water and Sanitation) and SDG 3 (Good Health and Well-being).
#
# Data Science Methodology, 10 steps. CLASSIFICATION (Safe / Unsafe). The
# field data has gaps, so the project compares four ways of handling
# missing values - the Unit 1 topic - with stratified 5-fold cross
# validation, before training the final Random Forest.
#
# Libraries: pandas, numpy, matplotlib, scikit-learn, joblib.
# ---------------------------------------------------------------------------

# %% Step 1 - Business Understanding
print("=" * 64)
print("IS THIS WATER SAFE TO DRINK?")
print("=" * 64)
print("Problem : the lab's verdict takes two days; people keep drinking meanwhile")
print("Goal    : predict the lab verdict from field-kit readings, the same day")
print()

# %% Step 2 - Analytic Approach
print("Analytic approach : predictive - classification (Safe or Unsafe)")
print()

# %% Step 3 - Data Requirements
import pandas as pd
import numpy as np
import matplotlib.pyplot as plt
from sklearn.model_selection import train_test_split, StratifiedKFold, cross_val_score
from sklearn.pipeline import make_pipeline
from sklearn.impute import SimpleImputer
from sklearn.ensemble import RandomForestClassifier
from sklearn.metrics import confusion_matrix, accuracy_score, precision_score, recall_score, f1_score
import joblib

pd.set_option("display.width", 140)
pd.set_option("display.max_columns", 20)

# %% Step 4 - Data Collection
data = pd.read_csv("water_samples.csv")
print("Samples collected :", len(data))
print(data.head(6))
print()

# %% Step 5 - Data Understanding
print("--- Step 5: Data Understanding ---")
missing = data.isnull().sum()
print("Missing values in each column:")
print(missing.to_string())
print()
print("Lab verdicts:")
print(data["verdict"].value_counts().to_string())
print("Share unsafe :", round((data["verdict"] == "Unsafe").mean() * 100, 1), "%")
print()
print("Share unsafe by kind of source (%):")
by_source = ((data["verdict"] == "Unsafe").groupby(data["source"]).mean() * 100).sort_values()
print(by_source.round(1).to_string())
print()

# Chart 1: how much is missing in each column.
m = (missing[missing > 0] / len(data) * 100).sort_values()
plt.figure(figsize=(7, 3.8))
plt.barh(m.index, m.values, color="#f28e2b")
plt.title("Missing values in the field data")
plt.xlabel("% of samples with no reading")
plt.tight_layout()
plt.savefig("chart1_missing.png")
plt.close()

# Chart 2: unsafe share by kind of source.
plt.figure(figsize=(7, 4))
plt.barh(by_source.index, by_source.values, color="#4e9fd1")
plt.title("Share of samples the lab found unsafe")
plt.xlabel("% unsafe")
plt.tight_layout()
plt.savefig("chart2_by_source.png")
plt.close()

# Chart 3: turbidity for safe and unsafe samples (log scale).
turb = pd.to_numeric(data["turbidity_ntu"])
plt.figure(figsize=(7, 4.2))
plt.boxplot([turb[data["verdict"] == "Safe"].dropna(), turb[data["verdict"] == "Unsafe"].dropna()],
            labels=["Safe", "Unsafe"])
plt.yscale("log")
plt.axhline(5, color="#e15759", linestyle="--", label="IS 10500 limit: 5 NTU")
plt.title("Turbidity of safe and unsafe samples")
plt.ylabel("Turbidity (NTU, log scale)")
plt.legend()
plt.tight_layout()
plt.savefig("chart3_turbidity.png")
plt.close()

# %% Step 6 - Data Preparation
print("--- Step 6: Data Preparation ---")
before = len(data)
data = data.drop_duplicates()
print("Duplicate samples removed :", before - len(data))
for col in ["fluoride_mg_l", "nitrate_mg_l", "turbidity_ntu"]:
    data[col] = pd.to_numeric(data[col])
data["unsafe"] = (data["verdict"] == "Unsafe").astype(int)
data = pd.get_dummies(data, columns=["source"], dtype=int)
features = ["ph", "tds_mg_l", "turbidity_ntu", "nitrate_mg_l", "fluoride_mg_l", "chloride_mg_l",
            "residual_chlorine_mg_l", "source_Hand pump", "source_Open well", "source_Piped supply",
            "source_Pond", "source_Tube well"]
X = data[features]
y = data["unsafe"]

# Four ways of handling the missing values, each judged by stratified
# 5-fold cross validation. The filling happens INSIDE each pipeline, so it
# is learned from the training folds only and never sees the test fold.
folds = StratifiedKFold(n_splits=5, shuffle=True, random_state=2)
forest = RandomForestClassifier(n_estimators=300, min_samples_leaf=2, random_state=0)
complete = data.dropna(subset=features)
strategies = [
    ["A. Drop rows with a gap", None],
    ["B. Fill with the mean", make_pipeline(SimpleImputer(strategy="mean"), forest)],
    ["C. Fill with the median", make_pipeline(SimpleImputer(strategy="median"), forest)],
    ["D. Median + a 'was missing' column", make_pipeline(SimpleImputer(strategy="median", add_indicator=True), forest)],
]
print("Rows left if every row with a gap is dropped :", len(complete), "of", len(data))
recalls = []
for name, model in strategies:
    if model is None:
        r = cross_val_score(forest, complete[features], complete["unsafe"], cv=folds, scoring="recall")
        f = cross_val_score(forest, complete[features], complete["unsafe"], cv=folds, scoring="f1")
    else:
        r = cross_val_score(model, X, y, cv=folds, scoring="recall")
        f = cross_val_score(model, X, y, cv=folds, scoring="f1")
    recalls.append([name, r.mean(), f.mean()])
    print(name.ljust(36), "CV recall", round(r.mean(), 3), "  CV F1", round(f.mean(), 3))
print()

# Chart 4: the four strategies compared.
x = np.arange(4)
plt.figure(figsize=(8, 4.3))
plt.bar(x - 0.2, [r[1] for r in recalls], width=0.4, label="Recall (unsafe found)", color="#e15759")
plt.bar(x + 0.2, [r[2] for r in recalls], width=0.4, label="F1 score", color="#4e79a7")
plt.xticks(x, ["A. Drop", "B. Mean", "C. Median", "D. Median +\nindicator"])
plt.ylim(0.5, 1)
plt.ylabel("Mean over 5 folds")
plt.title("Four ways of handling missing values")
plt.legend()
plt.tight_layout()
plt.savefig("chart4_strategies.png")
plt.close()

# %% Step 7 - Modelling
print("--- Step 7: Modelling ---")
X_train, X_test, y_train, y_test = train_test_split(X, y, test_size=0.2, stratify=y, random_state=5)
# Strategy A scored best, but only on the 797 complete rows, and a deployed
# model cannot refuse every sample with a missing test. B, C and D tied, and
# the indicator columns added nothing, so the simplest - C, the median - is used.
model = make_pipeline(SimpleImputer(strategy="median"),
                      RandomForestClassifier(n_estimators=300, min_samples_leaf=2, random_state=0))
model.fit(X_train, y_train)
print("Strategy used          : C (fill with the median)")
print("Training samples       :", len(X_train), " Testing samples :", len(X_test))
print()

# %% Step 8 - Evaluation
print("--- Step 8: Evaluation ---")
pred = model.predict(X_test)
tn, fp, fn, tp = confusion_matrix(y_test, pred).ravel()
print("TP, FN, FP, TN :", tp, fn, fp, tn)
print("Accuracy       :", round(accuracy_score(y_test, pred), 3))
print("Precision      :", round(precision_score(y_test, pred), 3))
print("Recall         :", round(recall_score(y_test, pred), 3))
print("F1 score       :", round(f1_score(y_test, pred), 3))
print()
cv_recall = cross_val_score(model, X, y, cv=folds, scoring="recall")
print("Recall in each of the 5 folds :", np.round(cv_recall, 3))
print()

# A missed unsafe source is far worse than an extra lab test, so the
# threshold is lowered from 0.5 to 0.3.
threshold = 0.3
prob_test = model.predict_proba(X_test)[:, 1]
flag = (prob_test >= threshold).astype(int)
print("Threshold for 'unsafe'        :", threshold)
print("Recall at threshold 0.3       :", round(recall_score(y_test, flag), 3))
print("Precision at threshold 0.3    :", round(precision_score(y_test, flag), 3))
print("Unsafe sources missed at 0.3  :", int(((flag == 0) & (y_test == 1)).sum()), "of", int(y_test.sum()))
print()

# Chart 5: confusion matrix.
cm = confusion_matrix(y_test, pred, labels=[1, 0])
plt.figure(figsize=(5.5, 4.5))
plt.imshow(cm, cmap="Blues")
labels = [["TP", "FN"], ["FP", "TN"]]
for r in range(2):
    for c in range(2):
        plt.text(c, r, labels[r][c] + "\n" + str(cm[r][c]), ha="center", va="center", fontsize=13,
                 color="white" if cm[r][c] > cm.max() / 2 else "black")
plt.xticks([0, 1], ["Predicted unsafe", "Predicted safe"])
plt.yticks([0, 1], ["Unsafe", "Safe"])
plt.title("Confusion matrix (test samples)")
plt.tight_layout()
plt.savefig("chart5_confusion.png")
plt.close()

# Chart 6: which readings the forest relied on.
importance = pd.Series(model[-1].feature_importances_, index=features).sort_values()
print("Feature importance:")
print(importance.round(3).to_string())
print()
plt.figure(figsize=(7.5, 5.2))
plt.barh(importance.index, importance.values, color="#59a14f")
plt.title("What the Random Forest relied on")
plt.xlabel("Importance")
plt.tight_layout()
plt.savefig("chart6_importance.png")
plt.close()

# %% Step 9 - Deployment
print("--- Step 9: Deployment ---")
joblib.dump(model, "water_model.pkl")
model = joblib.load("water_model.pkl")
new = pd.DataFrame({
    "ph": [7.2, 7.8, 6.9], "tds_mg_l": [380, 1250, 520], "turbidity_ntu": [0.4, 2.1, 9.5],
    "nitrate_mg_l": [8.0, 30.0, np.nan], "fluoride_mg_l": [0.3, np.nan, 0.6], "chloride_mg_l": [110, 380, 150],
    "residual_chlorine_mg_l": [0.4, 0.0, 0.0], "source_Hand pump": [0, 1, 0], "source_Open well": [0, 0, 1],
    "source_Piped supply": [1, 0, 0], "source_Pond": [0, 0, 0], "source_Tube well": [0, 0, 0],
})
names = ["Piped supply, chlorinated", "Hand pump, fluoride not tested", "Open well, cloudy, nitrate not tested"]
prob = model.predict_proba(new)[:, 1]
for i in range(len(names)):
    if prob[i] >= threshold:
        verdict = "LIKELY UNSAFE - warn users, send to the lab first"
    else:
        verdict = "likely safe - confirm with the lab test"
    print(names[i].ljust(38), round(prob[i], 2), "->", verdict)
print()

# %% Step 10 - Feedback
print("--- Step 10: Feedback ---")
# After the monsoon, 250 more sources are tested. Rain washes dirt and
# sewage into wells and ponds, so contamination rises.
mon = pd.read_csv("monsoon_samples.csv")
mon["unsafe"] = (mon["verdict"] == "Unsafe").astype(int)
mon = pd.get_dummies(mon, columns=["source"], dtype=int)
mon_pred = (model.predict_proba(mon[features])[:, 1] >= threshold).astype(int)
print("Monsoon samples                    :", len(mon))
print("Share unsafe, before the monsoon   :", round(y.mean() * 100, 1), "%")
print("Share unsafe, after the monsoon    :", round(mon["unsafe"].mean() * 100, 1), "%")
print("Recall on the test samples (0.3)   :", round(recall_score(y_test, flag), 3))
print("Recall on the monsoon samples      :", round(recall_score(mon["unsafe"], mon_pred), 3))
print("Precision on the monsoon samples   :", round(precision_score(mon["unsafe"], mon_pred), 3))
if recall_score(mon["unsafe"], mon_pred) < recall_score(y_test, flag) - 0.05:
    print("Feedback: recall has fallen after the monsoon - add monsoon samples and retrain.")
else:
    print("Feedback: recall holds after the monsoon - the model can stay in use.")
The library calls it is built from
| Call | Step | What it does |
|---|---|---|
pd.read_csv() / isnull().sum() | Steps 4–5 | Reads the samples and counts the gaps |
groupby(source).mean() | Step 5 | Share unsafe for each kind of source |
pd.get_dummies() | Step 6 | One-hot encodes the source |
SimpleImputer(strategy="mean" / "median", add_indicator=...) | Step 6 | The missing-value strategies |
make_pipeline(imputer, RandomForestClassifier()) | Steps 6–7 | Fills gaps inside the model, without leaking test data |
StratifiedKFold + cross_val_score() | Steps 6, 8 | Compares strategies; checks recall in each fold |
confusion_matrix / precision / recall / f1 | Step 8 | The classification metrics |
predict_proba() >= 0.3 | Steps 8–10 | Flags unsafe sources at the chosen threshold |
joblib.dump() / load() | Step 9 | Saves and reloads the pipeline |
14Output of a real run
================================================================
IS THIS WATER SAFE TO DRINK?
================================================================
Problem : the lab's verdict takes two days; people keep drinking meanwhile
Goal    : predict the lab verdict from field-kit readings, the same day

Analytic approach : predictive - classification (Safe or Unsafe)

Samples collected : 1203
  sample_id        source    ph  tds_mg_l  turbidity_ntu  nitrate_mg_l  fluoride_mg_l  chloride_mg_l  residual_chlorine_mg_l verdict
0    W70001     Open well  7.33     298.0            3.7          38.6           0.62           43.0                    0.00    Safe
1    W70002     Tube well  8.07     409.0            0.8           5.3           0.88           99.0                    0.00    Safe
2    W70003  Piped supply  7.23     500.0            0.3           9.5           0.96          140.0                    0.48    Safe
3    W70004     Tube well  7.78     638.0            0.6           NaN            NaN          202.0                    0.00    Safe
4    W70005     Hand pump  8.08     390.0            4.9          33.2            NaN          119.0                    0.00  Unsafe
5    W70006     Open well  7.95     319.0            1.7          34.1           0.41           93.0                    0.00    Safe

--- Step 5: Data Understanding ---
Missing values in each column:
sample_id                   0
source                      0
ph                          0
tds_mg_l                    0
turbidity_ntu              60
nitrate_mg_l              120
fluoride_mg_l             265
chloride_mg_l               0
residual_chlorine_mg_l      0
verdict                     0

Lab verdicts:
verdict
Safe      727
Unsafe    476
Share unsafe : 39.6 %

Share unsafe by kind of source (%):
source
Piped supply    10.8
Tube well       32.6
Hand pump       45.3
Open well       80.2
Pond            81.7

--- Step 6: Data Preparation ---
Duplicate samples removed : 3
Rows left if every row with a gap is dropped : 797 of 1200
A. Drop rows with a gap              CV recall 0.86   CV F1 0.91
B. Fill with the mean                CV recall 0.821   CV F1 0.877
C. Fill with the median              CV recall 0.819   CV F1 0.879
D. Median + a 'was missing' column   CV recall 0.821   CV F1 0.877

--- Step 7: Modelling ---
Strategy used          : C (fill with the median)
Training samples       : 960  Testing samples : 240

--- Step 8: Evaluation ---
TP, FN, FP, TN : 76 19 2 143
Accuracy       : 0.912
Precision      : 0.974
Recall         : 0.8
F1 score       : 0.879

Recall in each of the 5 folds : [0.811 0.842 0.832 0.811 0.8  ]

Threshold for 'unsafe'        : 0.3
Recall at threshold 0.3       : 0.874
Precision at threshold 0.3    : 0.847
Unsafe sources missed at 0.3  : 12 of 95

Feature importance:
source_Hand pump          0.007
source_Tube well          0.009
source_Pond               0.015
source_Open well          0.034
residual_chlorine_mg_l    0.044
chloride_mg_l             0.052
tds_mg_l                  0.054
source_Piped supply       0.065
fluoride_mg_l             0.148
ph                        0.167
nitrate_mg_l              0.183
turbidity_ntu             0.222

--- Step 9: Deployment ---
Piped supply, chlorinated              0.03 -> likely safe - confirm with the lab test
Hand pump, fluoride not tested         0.22 -> likely safe - confirm with the lab test
Open well, cloudy, nitrate not tested  0.98 -> LIKELY UNSAFE - warn users, send to the lab first

--- Step 10: Feedback ---
Monsoon samples                    : 250
Share unsafe, before the monsoon   : 39.6 %
Share unsafe, after the monsoon    : 52.4 %
Recall on the test samples (0.3)   : 0.874
Recall on the monsoon samples      : 0.931
Precision on the monsoon samples   : 0.961
Feedback: recall holds after the monsoon - the model can stay in use.15The same project in Orange
Orange's Impute widget offers the same missing-value strategies, and Test and Score compares them. The tool is Orange Data Mining.
| Widget | What it does |
|---|---|
| File | Load water_samples.csv; set verdict as the target and sample_id as meta. |
| Feature Statistics | See how much is missing in each column. |
| Impute | Try average, the most frequent value, or 'remove instances with unknown values' — strategies A to C. |
| Random Forest | The learner. |
| Test and Score | Stratified 5-fold cross validation for each Impute setting; read recall with target Unsafe. |
| Confusion Matrix | Count the unsafe sources missed. |
16Testing
Every case was run: each gives the whole program a small input of its own.
| Test case | Expected | Actual | Result |
|---|---|---|---|
| All samples read | Samples collected : 1203 | Samples collected : 1203 | Pass |
| Three samples entered twice are removed | Duplicate samples removed : 3 | Duplicate samples removed : 3 | Pass |
| Dropping every row with a gap would lose a third of the data | Rows left if every row with a gap is dropped : 797 of 1200 | Rows left if every row with a gap is dropped : 797 of 1200 | Pass |
| A lower threshold catches more unsafe sources | Recall at threshold 0.3 : 0.874 | Recall at threshold 0.3 : 0.874 | Pass |
| A sample with two tests missing still gets a prediction | Open well, cloudy, nitrate not tested 0.98 -> LIKELY UNSAFE - warn users, send to the lab first | Open well, cloudy, nitrate not tested 0.98 -> LIKELY UNSAFE - warn users, send to the lab first | Pass |
| Safe and unsafe samples that never overlap: none missed | Recall : 1.0 | Recall : 1.0 | Pass |
| A third of fluoride readings blank: rows are filled, not lost | Recall : 1.0 | Recall : 1.0 | Pass |
| The data file is missing | FileNotFoundError: [Errno 2] No such file or directory: 'water_samples.csv' | FileNotFoundError: [Errno 2] No such file or directory: 'water_samples.csv' | Pass |
17Team roles and timeline
A capstone is done by a group of 3 to 5. A suggested split of the work, and a timeline across the year:
| Role | Responsible for |
|---|---|
| Project lead | Business understanding; interviews with testers, the chemist and the committee |
| Data lead | Field and laboratory data; IS 10500 limits; recording rules for skipped tests |
| Analyst | The missing-value comparison and the exploratory charts |
| Modeller | The Random Forest pipeline, cross validation and the threshold |
| Documentation and video | Report, monsoon feedback analysis and the 3-minute video |
| When | Methodology steps | Deliverable |
|---|---|---|
| April – May | 1 Business Understanding, 2 Analytic Approach | Problem statement; interviews |
| June – July | 3 Data Requirements, 4 Data Collection | Field and lab data matched sample by sample |
| August | 5 Data Understanding, 6 Data Preparation | Missing-value strategies compared |
| September – October | 7 Modelling, 8 Evaluation | Model trained; threshold set for recall |
| November | 9 Deployment, 10 Feedback | Post-monsoon samples checked |
| December – January | Documentation and video | Report and 3-minute video |
18Results, limits and what next
- Field readings predict the lab's verdict with accuracy 0.912; with the threshold at 0.3, recall for unsafe water is 0.874.
- Dropping rows with gaps looked best but would leave a third of real samples without a prediction; mean, median and median-plus-indicator tied, so the median was used.
- Turbidity, nitrate, pH and fluoride matter most; chlorinated piped supply is the safest source and open wells and ponds the riskiest.
- The sources still missed are mostly bacterial contamination with normal chemistry — invisible to a field kit.
- After the monsoon, unsafe sources rose from 39.6 % to 52.4 %, and the model's recall held.
Limitations
- Sample data; real field and lab data must be matched sample by sample
- Cannot detect bacteria directly — the lab test remains essential
- Arsenic, iron and other contaminants important in some districts are not included
- One region and two seasons only
Future scope
- Add arsenic and iron for districts where they are a problem
- Add a simple field test for bacteria, such as an H2S strip, as a feature
- Train on a full year of samples across all seasons
- Build a phone form for testers around water_model.pkl
What the team had to learn
- Handling missing values: dropping, mean, median and indicator columns
- Why imputation must happen inside cross validation (pipelines)
- Reading a comparison carefully — when a better score answers a different question
- The Indian drinking-water standard IS 10500
19Conclusion
The capstone shows that a field-kit test can predict the laboratory's verdict on the same day, catching most unsafe sources two days earlier than the lab can.
Missing values turned out to be the decision that most needed care. The strategy that scored highest would have quietly refused a third of real samples; reading the comparison properly mattered more than the numbers in it.
The model's limit is clear and must be stated: it cannot see bacteria in water that otherwise looks normal. As a warning system it saves days; as a replacement for the lab it would be dangerous.
20The 3-minute video script
Part C asks for a video of exactly three minutes with six parts. A script, timed to the second:
| Time | Part | What to say and show |
|---|---|---|
| 0:00 – 0:25 | a. Problem statement | Show a hand pump and a field kit. "The lab tells a village whether its water is safe — two days later. Until then, everyone keeps drinking." |
| 0:25 – 0:40 | b. SDG alignment | SDG 6 and SDG 3 icons. "Safe drinking water for all — and fewer children sick from it." |
| 0:40 – 1:15 | c. AI concepts and algorithms | "Predictive classification with a Random Forest. We compared four ways of handling missing values with stratified 5-fold cross validation, and tuned the threshold for recall." |
| 1:15 – 2:15 | d. How it works | Show chart 1 (the gaps), chart 4 (the four strategies), the threshold result, and three new samples — including two with missing readings — getting a verdict. |
| 2:15 – 2:45 | e. Conclusion | "Same-day warnings for most unsafe sources. The lab test still decides — the model cannot see bacteria." |
| 2:45 – 3:00 | f. Acknowledgement | "We thank our AI teacher, [name], and the testers and chemists who helped us." |
21Questions for the viva
▸Why didn't you simply drop rows with missing values?
It would lose a third of the data, and the deployed model could not give a prediction for any sample with a skipped test. Its higher score was on a smaller, easier set.
▸Why is the imputer inside the pipeline?
So the median is learned from the training data only, and new samples with missing readings are filled the same way when the model is used.
▸Why did you choose the median over the mean?
They scored the same, and the median is not pulled by extreme readings, which water data has.
▸E. coli is not in your data. How can the model predict it?
It learns from clues linked to contamination — high turbidity, no residual chlorine, open sources. It cannot see bacteria directly, which is why some unsafe sources are still missed.
▸Why did you lower the threshold to 0.3?
A missed unsafe source can make people ill, while a false alarm only means boiling water until the lab confirms. Lowering the threshold raised recall.
▸What did the Feedback step show?
After the monsoon far more sources were unsafe, and the model's recall held — because monsoon contamination usually comes with cloudy water.
▸What is IS 10500?
The Indian standard for drinking water, which sets limits for pH, dissolved solids, turbidity, nitrate, fluoride, chloride and bacteria.
▸Which SDGs does it align to?
SDG 6, Clean Water and Sanitation, and SDG 3, Good Health and Well-being.
22References
- Bureau of Indian Standards, IS 10500:2012 — Drinking Water Specification (Second Revision).
- Jal Jeevan Mission, Ministry of Jal Shakti — Water Quality Management Information System — https://jaljeevanmission.gov.in/
- World Health Organization, Guidelines for Drinking-water Quality (4th ed., 2022).
- scikit-learn: SimpleImputer and Pipelines — https://scikit-learn.org/stable/modules/impute.html
- CBSE, Artificial Intelligence (Subject Code 843), Class XII curriculum, 2026-27 — Part C
- CBSE, Artificial Intelligence Student Handbook, Class XII — Unit 2, Data Science Methodology
- Rollins, J. B. (2015). Foundational Methodology for Data Science. IBM Analytics.
- scikit-learn — https://scikit-learn.org/stable/; pandas, NumPy and Matplotlib documentation
- LambdaLab — https://www.lambdalab.in