What the School Buses Really Cost
A school year of driver's logs — and one route whose diesel alone costs more than twice the fee it collects.
1Introduction: the problem it solves
A school with eight buses collects one transport fee from every child, whatever route they are on. The fee was set years ago on somebody's estimate. Since then diesel has moved, the routes have grown, and nobody has checked.
The information to check it with is written down every single day. The driver fills in a log — the route, the bus, the kilometres, the diesel and the number of children on board — and the sheets go into a file that nobody adds up. Two thousand of them accumulate in a year.
This project reads that log and asks five questions: what the school actually spends on diesel, what it costs to carry one child on each route, which buses are drinking fuel, how full the buses run, and whether the fee is covering the diesel at all. The last one has an uncomfortable answer.
A school's transport in-charge, the accounts office, and whoever has to answer parents when the bus fee goes up.
Why it is worth doing on a computer
A flat fee across routes of very different lengths is a decision, and at the moment it is an unexamined one. Route 8 runs 28 kilometres each way for nineteen children; Route 6 runs under seven for fifty-five. Charging both the same is defensible — a school may well decide to subsidise the village route deliberately — but it should be a choice made with the figures in front of it, and until now the figures did not exist.
The second reason is mechanical. Mileage is the earliest warning a vehicle gives that something is wrong, and it is invisible day to day: nobody notices half a litre. Over a year and 14,000 kilometres it is enormous, and comparing the fleet against itself finds it without any special equipment.
Objectives
- To read a school year of driver's logs out of one CSV file
- To clean it: the same sheet copied twice, blank fuel columns, and route names typed in different cases
- To work out the fuel cost of every trip from the litres and the day's diesel rate
- To show what the school spends on diesel month by month
- To rank the routes by what it costs in diesel to carry one child for the year
- To compare the buses on kilometres per litre, and find the ones due for servicing
- To measure how full the buses actually run against the children on their rolls
- To set the diesel cost of each route against the fee that route collects
2How the job is done today
Before writing anything it is worth asking how the work is handled at present, and where each of those answers falls short. These were examined:
Where all this data comes from. It is filled in faithfully and read by nobody: the sheets go into a file and stay there, so a year of them answers no question at all.
They know exactly what the school spent on diesel. They cannot break it down by route or by bus, because a bill is for a tanker and not for a journey.
Several schools have one, and it does show distance and route. It is a running subscription, it is aimed at telling parents where the bus is, and it usually knows nothing about fuel or fees.
Worth doing and how the project started. Drivers know which bus is thirsty. They do not know that Route 8's diesel is 235 per cent of the fee it collects, because nobody has ever set the two side by side.
3Where the data came from
CBSE asks that any resource used in a project be suitably referenced, and for a data project that rule is not a formality — a figure with no source attached to it does not mean anything. This section is the one an examiner will ask about.
The driver of each bus fills in one line a day: date, route, bus number, how many children are on the roll for that route, how many actually travelled, the kilometres run, the diesel taken and the rate paid for it. The transport in-charge collects the sheets weekly.
One school year of those sheets — July to April, minus Sundays and the summer break — is 2,089 lines. No child is named anywhere; the log records a count, which is all the analysis needs.
The dataset here is a LambdaLab sample standing in for that log, with a sheet copied twice, five days a driver did not fill the fuel column, and two route names typed in lower case. Use your own school's logs in your submission, with the transport in-charge's permission, and say which school and which year.
4The dataset
One file in, one file out. transport.csv is the driver's log as it is already written — one row per bus per day. Nothing has to be rearranged to type it in, which matters when the person typing it is doing it after school.
transport.csv — one row per bus per day
| Field | Type | What it holds |
|---|---|---|
date | date (YYYY-MM-DD) | The day of the trip. |
route | text | e.g. R4 Krishna Nagar. Typed by hand, so it needs tidying. |
bus_no | text | The vehicle's registration number. |
students_on_roll | integer | Children registered for that route. |
students_present | integer | Children who actually travelled that day. |
km_run | decimal | Kilometres for the round trip. |
diesel_litres | decimal | Diesel taken. Blank when the driver did not fill it in. |
diesel_rate | decimal | Price per litre that day. |
The first few lines of transport.csv
| date | route | bus_no | students_on_roll | students_present | km_run | diesel_litres | diesel_rate |
|---|---|---|---|---|---|---|---|
2025-07-01 | R1 Civil Lines | UP16-AB-1201 | 46 | 43 | 23.3 | 4.35 | 93.64 |
2025-07-01 | R2 Sector 9 | UP16-AB-1202 | 52 | 46 | 17.1 | 3.45 | 93.64 |
2025-07-01 | R3 Railway Colony | UP16-AB-1203 | 38 | 28 | 28.9 | 5.76 | 93.64 |
2025-07-01 | R4 Krishna Nagar | UP16-AB-1204 | 41 | 30 | 34.9 | 7.54 | 93.64 |
2025-07-01 | R5 Old Town | UP16-AB-1205 | 29 | 25 | 42.4 | 10.45 | 93.64 |
2025-07-01 | R6 Green Park | UP16-AB-1206 | 55 | 45 | 14.3 | 2.42 | 93.64 |
2025-07-01 | R7 Industrial Area | UP16-AB-1207 | 23 | 21 | 49.6 | 12.45 | 93.64 |
2025-07-01 | R8 Village Road | UP16-AB-1208 | 19 | 14 | 57.4 | 17.04 | 93.64 |
Inside transport.csv
The driver's log for a school year: 2,089 rows, eight routes, ten months, with the mistakes a handwritten log has in it. The whole file is 2,089 rows, 125.7 KB — too much to print here, so this is the head of it. The complete file comes with the download, and you can also take it on its own.
date,route,bus_no,students_on_roll,students_present,km_run,diesel_litres,diesel_rate
2025-07-01,R1 Civil Lines,UP16-AB-1201,46,43,23.3,4.35,93.64
2025-07-01,R2 Sector 9,UP16-AB-1202,52,46,17.1,3.45,93.64
2025-07-01,R3 Railway Colony,UP16-AB-1203,38,28,28.9,5.76,93.64
2025-07-01,R4 Krishna Nagar,UP16-AB-1204,41,30,34.9,7.54,93.64
2025-07-01,R5 Old Town,UP16-AB-1205,29,25,42.4,10.45,93.64
2025-07-01,R6 Green Park,UP16-AB-1206,55,45,14.3,2.42,93.64
2025-07-01,R7 Industrial Area,UP16-AB-1207,23,21,49.6,12.45,93.64
2025-07-01,R8 Village Road,UP16-AB-1208,19,14,57.4,17.04,93.645Cleaning the data
Real data arrives with mistakes in it, and this dataset has the ones real data actually has. What was wrong, how much of it there was, and what the program does about each — because how a problem is handled changes the answer, and a report has to say which choice it made.
drop_duplicates(). One bus makes one entry a day, so an identical repeat is a copying slip and would otherwise double that day's fuel.
str.strip().str.title(). Left alone the program would report ten routes for eight buses, and two of them would have absurdly small totals.
dropna(subset=["diesel_litres"]) and the count is printed. The trip happened, so it is a real trip — but it cannot be costed, and inventing a figure for it would put fuel on the books that nobody bought.
pd.set_option("display.width", 110). By default pandas replaces the middle columns of a wide table with "...", which is useless in a report. Two lines at the top fix it.
6What the program does
- Reads a school year of driver's logs from one CSV file
- Cleans it: a duplicated sheet, blank fuel entries and route names in two cases
- Costs every trip from its litres and that day's diesel rate
- Shows the school's diesel bill month by month, and how far the rate moved across the year
- Ranks routes by the diesel cost of carrying one child for the year
- Compares every bus on kilometres per litre against the fleet average
- Measures how full the buses run, as a percentage of each route's roll
- Sets each route's diesel against the transport fee that route collects
- Writes a route summary out as a CSV
The pandas and pyplot it is built from
| Call | Where | What it is for |
|---|---|---|
pd.set_option("display.width", ...) | top | Stops pandas folding a wide table into dots |
pd.read_csv(..., parse_dates=) | step 1 | Loads the log with real dates |
df.drop_duplicates() | step 2 | Removes the sheet that was copied twice |
Series.str.strip().str.title() | step 2 | Ten route names become eight again |
df.dropna(subset=[...]) | step 2 | Drops the trips that cannot be costed |
df[a] * df[b] | step 3 | The fuel cost of every trip, in one line |
Series.dt.to_period("M") | step 4 | Groups a whole month together |
df.groupby(c).agg(name=(col, how)) | steps 4, 5 | Several different totals in one pass, each named |
DataFrame.sort_values(col) | steps 4, 5 | Ranks the routes and the buses |
Series.nunique() | step 6 | How many months the file actually covers |
df.iloc[0] / df.iloc[-1] | step 4 | The first and last rows, for the diesel rate at each end of the year |
plt.axhline() | chart 3 | The dashed line marking the fleet average |
plt.barh() | chart 2 | Sideways bars, because route names are long |
plt.xticks(rotation=, ha=) | charts 3, 5 | Angles the labels so they do not overlap |
DataFrame.to_csv() | step 7 | Writes the route summary out |
7Technical details
| Language | Python 3 |
| Where the data lives | A plain CSV file, read into pandas |
| Libraries |
|
8How it works, step by step
read_csv() with parse_dates loads transport.csv — 2,089 rows across ten months.
The duplicated sheet goes, route names are title-cased, and trips with no fuel entry are dropped and counted.
Three columns: the fuel cost of the trip, the mileage in kilometres per litre, and how full the bus was as a percentage of its roll.
agg() works out the trips, kilometres, fuel and average occupancy of each route in one pass, each with the name it should carry.
The same idea one level across: total kilometres and total litres per vehicle, divided to give the year's real mileage.
Each route's roll times the monthly fee times the months in the file gives what it collected, and the diesel is set against it as a percentage.
Five charts — a line, two horizontal and vertical bars and a histogram — each saved with savefig().
9Source code
The whole program. Every chart further down this page was drawn by this listing, and every figure quoted came out of running it.
# ---------------------------------------------------------------------------
# transport_analysis.py
#
# The school runs eight buses and the transport in-charge keeps a daily log:
# which bus, which route, how far it went, how much diesel it drank and how
# many children were on it. Nobody adds the log up. This program does, and
# answers the questions the school asks once a year, badly:
#
#   1. What does the school actually spend on diesel, month by month?
#   2. Which route costs the most to run, per child carried?
#   3. Which buses are heavy on fuel and due for servicing?
#   4. How full are the buses really?
#   5. Is the transport fee covering the cost?
#
# The fee is per child per month. Change FEE to your own school's.
# ---------------------------------------------------------------------------

import pandas as pd
import matplotlib.pyplot as plt

FEE = 900.00        # transport fee charged per child per month

# A wide table is folded into "..." at the default width, which is no use in
# a report. These two lines make pandas print the whole thing.
pd.set_option("display.width", 110)
pd.set_option("display.max_columns", 12)

# --- 1. Read and clean ---------------------------------------------------
df = pd.read_csv("transport.csv", parse_dates=["date"])
print("Log entries read :", len(df))

before = len(df)
df = df.drop_duplicates()
print("Duplicate entries:", before - len(df))

# The route name is typed by hand every day, so the same route arrives in
# two spellings. Without this every figure below would be split in two.
df["route"] = df["route"].str.strip().str.title()

# A blank diesel column means the driver did not fill the log. That trip
# cannot be costed, so it is left out of anything about fuel — but it is
# still a real trip, so the count is printed.
no_diesel = df["diesel_litres"].isnull().sum()
df = df.dropna(subset=["diesel_litres"])
print("Trips with no fuel entry:", no_diesel, "(dropped)")
print("Trips used       :", len(df))
print("Routes           :", df["route"].nunique())
print("From", df["date"].min().date(), "to", df["date"].max().date())
print()

# --- 2. Derive -----------------------------------------------------------
df["fuel_cost"] = (df["diesel_litres"] * df["diesel_rate"]).round(2)
df["mileage"] = (df["km_run"] / df["diesel_litres"]).round(2)     # km per litre
# How full the bus was, as a percentage of the children on its roll.
df["occupancy"] = (df["students_present"] / df["students_on_roll"] * 100).round(1)

print("Diesel bought    :", round(df["diesel_litres"].sum(), 2), "litres")
print("Spent on diesel  : Rs", round(df["fuel_cost"].sum(), 2))
print("Distance covered :", round(df["km_run"].sum(), 1), "km")
print("Cost per km      : Rs", round(df["fuel_cost"].sum() / df["km_run"].sum(), 2))
print()

# --- 3. Question 1: the monthly bill -------------------------------------
df["month"] = df["date"].dt.to_period("M").astype(str)
monthly = df.groupby("month")["fuel_cost"].sum().round(2)

print("--- Diesel bill, month by month ---")
print(monthly)
print()
print("Dearest month :", monthly.idxmax(), "at Rs", monthly.max())
print("Average diesel rate in the year: Rs", round(df["diesel_rate"].mean(), 2))
print("Rate on the first day / last day: Rs", df.iloc[0]["diesel_rate"],
      "/ Rs", df.iloc[-1]["diesel_rate"])
print()

plt.figure(figsize=(9, 4.5))
plt.plot(monthly.index, monthly.values, marker="o", color="#e07b39")
plt.title("What the school spent on diesel, month by month")
plt.xlabel("Month")
plt.ylabel("Diesel bill (Rs)")
plt.xticks(rotation=45)
plt.grid(True, linestyle="--", alpha=0.5)
plt.tight_layout()
plt.savefig("chart1_monthly_fuel.png")
plt.close()

# --- 4. Question 2: cost per child, route by route -----------------------
# agg() lets several different sums be worked out in one pass, each with the
# name it should have in the result.
route = df.groupby("route").agg(
    trips=("date", "count"),
    km=("km_run", "sum"),
    fuel=("fuel_cost", "sum"),
    avg_present=("students_present", "mean"),
    roll=("students_on_roll", "max"),
).round(2)
# The figure that matters: what it costs to carry one child for a year.
route["cost_per_child"] = (route["fuel"] / route["avg_present"]).round(2)

print("--- Route by route ---")
print(route.sort_values("cost_per_child", ascending=False))
print()

order = route.sort_values("cost_per_child")
plt.figure(figsize=(8.5, 5))
plt.barh(order.index, order["cost_per_child"], color="#3b7dd8")
plt.title("Diesel cost of carrying one child for the year, by route")
plt.xlabel("Cost per child (Rs)")
plt.tight_layout()
plt.savefig("chart2_cost_per_child.png")
plt.close()

# --- 5. Question 3: which buses are thirsty? -----------------------------
bus = df.groupby("bus_no").agg(
    km=("km_run", "sum"),
    litres=("diesel_litres", "sum"),
).round(2)
bus["km_per_litre"] = (bus["km"] / bus["litres"]).round(2)
bus = bus.sort_values("km_per_litre")

print("--- Mileage, bus by bus ---")
print(bus)
print()
worst, best = bus.index[0], bus.index[-1]
print("Worst:", worst, "at", bus.loc[worst, "km_per_litre"], "km/l")
print("Best :", best, "at", bus.loc[best, "km_per_litre"], "km/l")
print("The worst bus needs", round(bus.loc[best, "km_per_litre"] /
      bus.loc[worst, "km_per_litre"], 2), "times the diesel of the best.")
print()

plt.figure(figsize=(8.5, 4.5))
plt.bar(bus.index, bus["km_per_litre"], color="#4c9f70")
plt.axhline(bus["km_per_litre"].mean(), color="#c0392b", linestyle="--",
            label="Fleet average")
plt.title("Mileage of each bus over the school year")
plt.xlabel("Bus")
plt.ylabel("Kilometres per litre")
plt.xticks(rotation=30)
plt.legend()
plt.tight_layout()
plt.savefig("chart3_mileage.png")
plt.close()

# --- 6. Question 4: how full are the buses? ------------------------------
print("--- How full a bus is, as a percentage of its roll ---")
print(df["occupancy"].describe().round(1))
print()
by_route_occ = df.groupby("route")["occupancy"].mean().round(1).sort_values()
print("--- Average occupancy by route ---")
print(by_route_occ)
print()

plt.figure(figsize=(8, 4.5))
plt.hist(df["occupancy"].values, bins=12, color="#a05fc0", edgecolor="white")
plt.title("How full the buses run")
plt.xlabel("Children present as a percentage of the roll")
plt.ylabel("Number of trips")
plt.tight_layout()
plt.savefig("chart4_occupancy.png")
plt.close()

# --- 7. Question 5: does the fee cover the diesel? -----------------------
months = df["month"].nunique()
route["fee_collected"] = (route["roll"] * FEE * months).round(2)
route["fuel_share"] = (route["fuel"] / route["fee_collected"] * 100).round(1)

print("--- Diesel as a share of the fee collected ---")
print(route[["roll", "fuel", "fee_collected", "fuel_share"]]
      .sort_values("fuel_share", ascending=False))
print()
print("Fleet: diesel is", round(route["fuel"].sum() /
      route["fee_collected"].sum() * 100, 1), "% of the fee collected.")
print("The rest has to pay for drivers, tyres, insurance and repairs.")
print()

share = route.sort_values("fuel_share")
plt.figure(figsize=(8.5, 4.5))
plt.bar(share.index, share["fuel_share"], color="#c9772f")
plt.title("Diesel as a share of the transport fee collected, by route")
plt.xlabel("Route")
plt.ylabel("Diesel as % of fee")
plt.xticks(rotation=30, ha="right")
plt.tight_layout()
plt.savefig("chart5_fee_share.png")
plt.close()

route.to_csv("route_summary.csv")
print("Charts saved : chart1_monthly_fuel.png .. chart5_fee_share.png")
print("Summary saved: route_summary.csv")The full report as a PDF, ready to print and fill in. Or the working project as a zip — the program, the dataset, the charts and a README.
10Sample output
A real run, reproduced exactly as it appeared. Nothing below was typed by hand — it is the transcript of the program above against the dataset in section 4.
Log entries read : 2089
Duplicate entries: 1
Trips with no fuel entry: 5 (dropped)
Trips used       : 2083
Routes           : 8
From 2025-07-01 to 2026-04-30

Diesel bought    : 16274.34 litres
Spent on diesel  : Rs 1581066.99
Distance covered : 69444.6 km
Cost per km      : Rs 22.77

--- Diesel bill, month by month ---
month
2025-07    158153.44
2025-08    154228.85
2025-09    155675.37
2025-10    162484.41
2025-11    149192.48
2025-12    165006.06
2026-01    164138.62
2026-02    148112.83
2026-03    161733.52
2026-04    162341.41
Name: fuel_cost, dtype: float64

Dearest month : 2025-12 at Rs 165006.06
Average diesel rate in the year: Rs 97.15
Rate on the first day / last day: Rs 93.64 / Rs 100.58

--- Route by route ---
                    trips       km       fuel  avg_present  roll  cost_per_child
route
R8 Village Road       261  14823.4  401911.93        15.57    19        25813.23
R7 Industrial Area    260  12986.8  301311.82        18.79    23        16035.75
R5 Old Town           260  11174.0  278635.54        23.99    29        11614.65
R4 Krishna Nagar      260   9192.4  195687.65        34.46    41         5678.69
R3 Railway Colony     261   7347.7  149760.43        31.81    38         4707.97
R1 Civil Lines        261   6041.1  108956.31        38.39    46         2838.14
R2 Sector 9           261   4319.5   82871.18        43.54    52         1903.33
R6 Green Park         259   3559.7   61932.13        45.57    55         1359.05

--- Mileage, bus by bus ---
                   km   litres  km_per_litre
bus_no
UP16-AB-1208  14823.4  4137.02          3.58
UP16-AB-1205  11174.0  2868.06          3.90
UP16-AB-1207  12986.8  3101.56          4.19
UP16-AB-1204   9192.4  2014.06          4.56
UP16-AB-1203   7347.7  1541.51          4.77
UP16-AB-1202   4319.5   853.05          5.06
UP16-AB-1201   6041.1  1121.57          5.39
UP16-AB-1206   3559.7   637.51          5.58

Worst: UP16-AB-1208 at 3.58 km/l
Best : UP16-AB-1206 at 5.58 km/l
The worst bus needs 1.56 times the diesel of the best.

--- How full a bus is, as a percentage of its roll ---
count    2083.0
mean       83.0
std         7.5
min        68.4
25%        76.4
50%        82.8
75%        89.5
max        96.6
Name: occupancy, dtype: float64

--- Average occupancy by route ---
route
R7 Industrial Area    81.7
R8 Village Road       82.0
R5 Old Town           82.7
R6 Green Park         82.9
R1 Civil Lines        83.5
R2 Sector 9           83.7
R3 Railway Colony     83.7
R4 Krishna Nagar      84.0
Name: occupancy, dtype: float64

--- Diesel as a share of the fee collected ---
                    roll       fuel  fee_collected  fuel_share
route
R8 Village Road       19  401911.93       171000.0       235.0
R7 Industrial Area    23  301311.82       207000.0       145.6
R5 Old Town           29  278635.54       261000.0       106.8
R4 Krishna Nagar      41  195687.65       369000.0        53.0
R3 Railway Colony     38  149760.43       342000.0        43.8
R1 Civil Lines        46  108956.31       414000.0        26.3
R2 Sector 9           52   82871.18       468000.0        17.7
R6 Green Park         55   61932.13       495000.0        12.5

Fleet: diesel is 58.0 % of the fee collected.
The rest has to pay for drivers, tyres, insurance and repairs.

Charts saved : chart1_monthly_fuel.png .. chart5_fee_share.png
Summary saved: route_summary.csv
Running it also wrote route_summary.csv — 8 rows. This is the head of it:
route,trips,km,fuel,avg_present,roll,cost_per_child,fee_collected,fuel_share
R1 Civil Lines,261,6041.1,108956.31,38.39,46,2838.14,414000.0,26.3
R2 Sector 9,261,4319.5,82871.18,43.54,52,1903.33,468000.0,17.7
R3 Railway Colony,261,7347.7,149760.43,31.81,38,4707.97,342000.0,43.8
R4 Krishna Nagar,260,9192.4,195687.65,34.46,41,5678.69,369000.0,53.0
R5 Old Town,260,11174.0,278635.54,23.99,29,11614.65,261000.0,106.8
R6 Green Park,259,3559.7,61932.13,45.57,55,1359.05,495000.0,12.5
R7 Industrial Area,260,12986.8,301311.82,18.79,23,16035.75,207000.0,145.6
R8 Village Road,261,14823.4,401911.93,15.57,19,25813.23,171000.0,235.011The charts, and what each one says
CBSE asks for appropriate charts, and the word doing the work in that phrase is appropriate. A line for something that moves in order, a bar to compare things that do not, a histogram for the shape of one column of numbers. Each chart below says which it is, why that kind was chosen, and what it turned out to show.
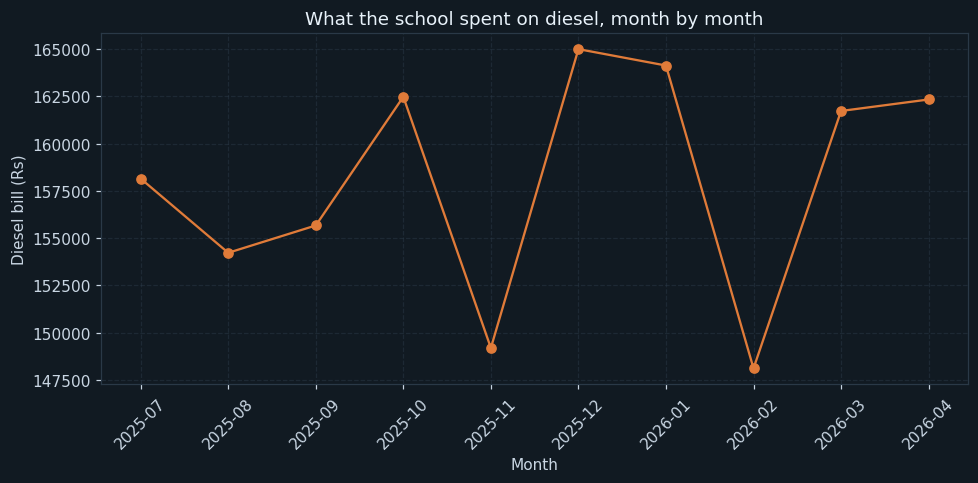
What the school spent on diesel in each month of the school year. A line, because the months are in order.
The bill sits between Rs 148,000 and Rs 165,000 a month and comes to Rs 1,581,067 for the year — 16,274 litres over 69,445 kilometres, which works out at Rs 22.77 a kilometre.
The line is nearly flat, and that is itself the finding. Diesel went from Rs 93.64 on the first day of the year to Rs 100.58 on the last — a rise of over seven per cent — and the monthly bill did not climb with it, because the number of school days in a month varies more than the price does. A school watching its fuel bill month to month would conclude nothing had happened. Something did.
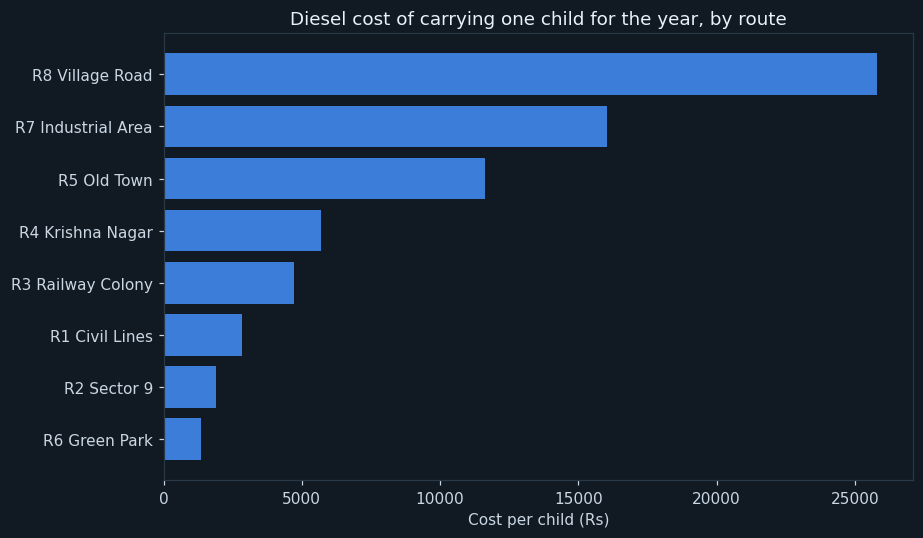
Each route's total diesel for the year divided by the average number of children it carried. Horizontal bars, because route names are long, and the fairest single comparison in this report.
Route 8 Village Road costs Rs 25,813 in diesel per child for the year. Route 6 Green Park costs Rs 1,359. That is a factor of nineteen between two routes of the same school, and every child on both pays the same fee.
Both halves of the fraction pull the same way, which is why the gap is so wide. Route 8 is the longest run at 28 kilometres each way and it carries the fewest children — 15.6 on an average day. Route 6 is under seven kilometres and carries 45.6. Long route, few children; short route, many. Nothing here says the school is doing anything wrong, but it does say that the flat fee is a subsidy, and it puts a number on it.
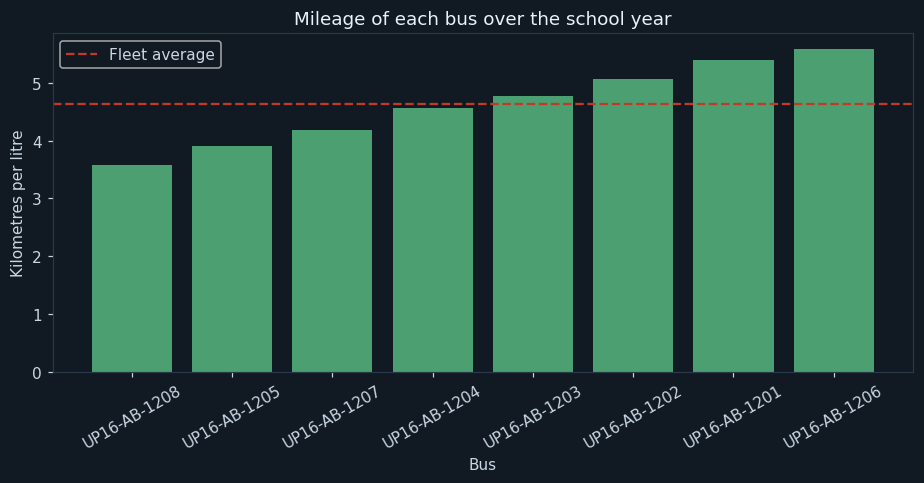
Kilometres per litre for each bus over the whole year, with a dashed line at the fleet average. A year of running, so this is not one bad tankful — it is the vehicle.
The fleet runs from 3.58 km per litre on UP16-AB-1208 to 5.58 on UP16-AB-1206. The worst bus needs 1.56 times the diesel of the best to cover the same ground.
Some of that is honest: a bus on a long rural route with fewer stops should do better, not worse, so the direction of the gap is the wrong way round for the route to explain it. UP16-AB-1208 and UP16-AB-1205, at 3.58 and 3.90, are the two the workshop should look at — and the finding cost nothing but a year of logs the school was already keeping.
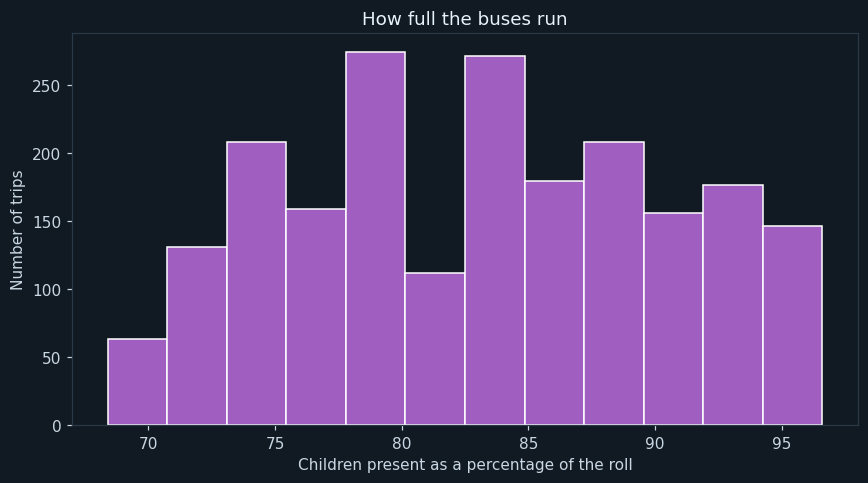
Every trip sorted by the percentage of that route's roll who actually travelled. A histogram, because the question is the spread across two thousand trips rather than any single day.
The average trip carries 83 per cent of its roll, and the middle half falls between 76.4 and 89.5. The emptiest trip of the year still carried 68.4 per cent and the fullest 96.6.
The useful reading is that the routes barely differ: every one averages between 81.7 and 84.0 per cent. Absence is a school-wide pattern, not a route-level one, so there is nothing here to fix by rerouting. It also means about one seat in six is paid for and empty on any given day, which is a fact worth knowing before anybody proposes charging by attendance.
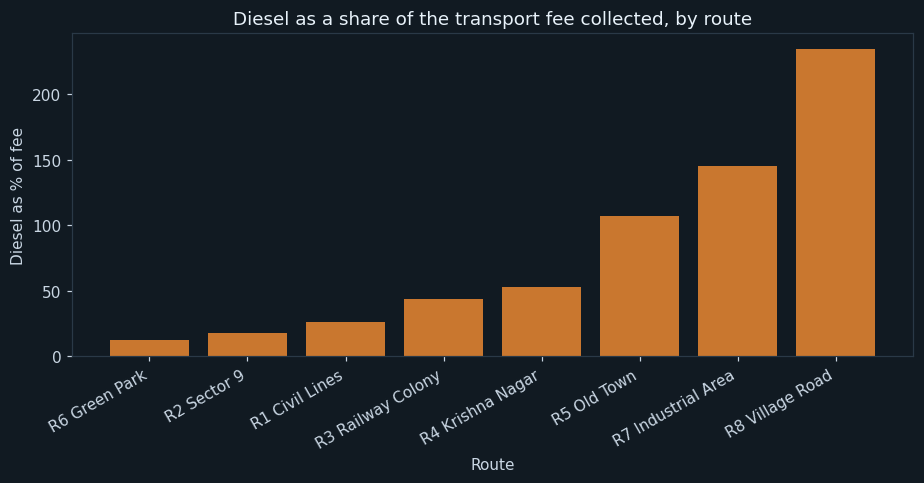
For each route, its diesel bill as a percentage of the transport fee that route collected — roll times Rs 900 a month times ten months. Anything above 100 means the diesel alone costs more than the fee.
Three routes are above 100 per cent. Route 8 Village Road is at 235 per cent — its diesel alone costs more than twice everything its nineteen families pay. Route 7 is at 145.6 and Route 5 at 106.8.
At the other end, Route 6 Green Park spends 12.5 per cent of its fee on diesel and Route 2 spends 17.7. Across the fleet diesel is 58 per cent of the fee collected, and the rest has to pay for drivers, tyres, insurance, repairs and the buses themselves — so a route at 106.8 per cent is not marginal, it is deeply loss-making once anything else is counted. The short routes are paying for the long ones, and now the school knows by how much.
12What the analysis found
- The school spent Rs 1,581,067 on diesel: 16,274 litres over 69,445 km, at Rs 22.77 a kilometre.
- Diesel rose from Rs 93.64 to Rs 100.58 across the year, and the monthly bill hid it.
- Carrying one child costs Rs 25,813 in diesel on Route 8 and Rs 1,359 on Route 6 — nineteen times as much.
- The worst bus does 3.58 km per litre and the best 5.58.
- Buses run at 83 per cent of their roll on average, and every route is within 81.7 to 84.0 per cent.
- Route 8's diesel is 235 per cent of the fee it collects; two more routes are also above 100 per cent.
- Across the fleet, diesel eats 58 per cent of the transport fee before any other cost is paid.
What should be done about them
This is the part that turns an analysis into a project. A chart that nobody acts on is a picture; a recommendation somebody can argue with is a result.
- Decide deliberately whether Route 8 is a subsidy the school wants to make. It costs Rs 401,912 in diesel and collects Rs 171,000.
- Send UP16-AB-1208 and UP16-AB-1205 to the workshop. A year of logs says these are the vehicles, not the routes.
- If the fee is ever to vary, vary it by route length rather than by anything else — that is what the second chart measures.
- Do not plan around occupancy. It is the same on every route and there is nothing to gain by rerouting.
- Watch the diesel rate directly, not the monthly bill. The bill hid a seven per cent rise for a year.
- Insist the fuel column is filled in. Five blank days is five trips that cannot be costed.
13Testing
Every case below was actually executed and its result recorded as it appeared — including the ones expected to fail. Each one builds a small dataset of its own and runs the whole program against it.
| Test case | Expected | Actual | Result |
|---|---|---|---|
| The full log, 2089 entries | Spent on diesel : Rs 1581066.99 | Spent on diesel : Rs 1581066.99 | Pass |
| A sheet copied twice is removed | Duplicate entries: 1 | Duplicate entries: 1 | Pass |
| Trips with no fuel entry are dropped and counted | Trips with no fuel entry: 5 (dropped) | Trips with no fuel entry: 5 (dropped) | Pass |
| Route names in two cases fold back into eight routes | Routes : 8 | Routes : 8 | Pass |
| Diesel is 58 per cent of the fee collected across the fleet | Fleet: diesel is 58.0 % of the fee collected. | Fleet: diesel is 58.0 % of the fee collected. | Pass |
| One trip: 5 litres at Rs 100 is Rs 500 of diesel | Spent on diesel : Rs 500.0 | Spent on diesel : Rs 500.0 | Pass |
| ...and 20 km on 5 litres is 4 km per litre | BUS-1 20.0 5.0 4.0 | BUS-1 20.0 5.0 4.0 | Pass |
| ...at a cost of Rs 25.0 a kilometre | Cost per km : Rs 25.0 | Cost per km : Rs 25.0 | Pass |
| The long route with few children costs Rs 200 per child | R8 Long 1 100.0 1000.0 5.0 5 200.0 | R8 Long 1 100.0 1000.0 5.0 5 200.0 | Pass |
| ...and the short one with many costs Rs 5 | R6 Short 1 20.0 200.0 40.0 40 5.0 | R6 Short 1 20.0 200.0 40.0 40 5.0 | Pass |
| ...so the long route eats 22.2 per cent of its fee and the short one 0.6 | R8 Long 5 1000.0 4500.0 22.2 | R8 Long 5 1000.0 4500.0 22.2 | Pass |
| Twenty children of a roll of forty is 50 per cent full | mean 50.0 | mean 50.0 | Pass |
| A full bus is 100 per cent, not more | mean 100.0 | mean 100.0 | Pass |
| Diesel of exactly the fee collected reads as 100 per cent | Fleet: diesel is 100.0 % of the fee collected. | Fleet: diesel is 100.0 % of the fee collected. | Pass |
| transport.csv missing altogether | FileNotFoundError: [Errno 2] No such file or directory: 'transport.csv' | FileNotFoundError: [Errno 2] No such file or directory: 'transport.csv' | Pass |
Two kinds of case are in there on purpose. The boundary cases test the edge of a rule, where a program is most often wrong by one. The failure cases check that it stops cleanly and says why, instead of quietly producing a wrong answer.
14Advantages
Set against the ways the job is done today:
- A log that was filed and forgotten now answers the questions the transport committee asks
- Route costs are compared per child, which is the only comparison that is fair between routes of different sizes
- A thirsty vehicle is found from records the school already keeps, with no equipment
- Fee and cost are set side by side, so a subsidy becomes a decision instead of an accident
- Adding next year's logs changes nothing in the program
- Nothing in the analysis identifies a child
15Limitations and future scope
What this version cannot tell you
A data project should be honest about the limits of its own data. Each of these is a reason for one of the additions below:
- Diesel only. Drivers, tyres, insurance, repairs and the cost of the buses themselves are not in the file, so every cost here is an underestimate
- One round trip a day is logged; a school running afternoon trips as well would need another row
- A blank fuel entry is dropped, so five trips are missing from every fuel figure
- Mileage is a year's average and cannot tell a mechanical fault from a heavier load
- The fee is taken as a flat Rs 900 for everybody, and real schools have concessions
What to add next
This is also where you make the project yours. Take one or two of these, or something nobody here thought of:
- Add driver salary, insurance and maintenance to get the true cost of a route
- Work out what fee each route would need to break even, and show it beside the flat fee
- Track mileage month by month per bus, so a fault is caught when it starts rather than at the year's end
- Add the number of stops and the time taken, and look at whether either explains the mileage gap
- Model what merging the two smallest routes would save
- Read the diesel rate from the fuel bills automatically instead of typing it daily
16What you may have to teach yourself
CBSE expects some self-learning in a project and says so. For this one, that means:
- agg() with named outputs — groupby(...).agg(km=("km_run", "sum")) — which is how several different totals come out of one pass with sensible column names
- Why a per-unit figure beats a total whenever the things being compared are different sizes. It is the same idea as the per-flat average in the electricity project and the per-copy demand in the library one.
- pd.set_option, and what pandas does to a wide table if you do not use it
- What your own school actually pays for transport beyond fuel — ask the accounts office, because that is what turns this from a fuel report into a cost report
17Conclusion
The program does what it set out to do. Two thousand driver's log sheets, previously filed and never read, come back as five charts and a route summary, and the transport committee has figures where it had impressions.
One finding is uncomfortable enough to be worth the whole project. Route 8 Village Road collects Rs 171,000 in fees over the year and burns Rs 401,912 of diesel doing it — before a single rupee of the driver's salary, the insurance or the tyres. Two other routes are also above 100 per cent. None of this means the school should stop running them; the village route may be exactly the one worth subsidising. It means the subsidy should be a decision the school makes on purpose, and until this was run nobody could have made it.
The quieter finding is about how the school had been watching the wrong number. Diesel rose more than seven per cent across the year and the monthly bill stayed flat, because a month with more school days in it cancels out a lower price. Anybody tracking the bill would have concluded that nothing changed. The rate is in the same file, one column across, and it says otherwise.
18References
Every report needs a bibliography, and a data project needs its data source at the top of it.
- The driver's log book of a school transport department, one school year, with the transport in-charge's permission. The dataset shipped here is a LambdaLab sample standing in for it.
- pandas user guide, “Group by: split-apply-combine”, on named aggregation — https://pandas.pydata.org/docs/user_guide/groupby.html#named-aggregation
- Matplotlib pyplot tutorial — https://matplotlib.org/stable/tutorials/pyplot.html
- Informatics Practices, Class XII — the NCERT / CBSE prescribed textbook, for the chapters on data handling with pandas and data visualisation
- pandas documentation — https://pandas.pydata.org/docs/
- Matplotlib documentation — https://matplotlib.org/stable/
- CBSE Senior School Curriculum, Informatics Practices (Subject Code 065) — the project guidelines this report follows
- LambdaLab — https://www.lambdalab.in