Who Actually Uses the Library
A year of the issue register, read out of MySQL — what children read, when they stop, and which book they are all waiting for.
1Introduction: the problem it solves
A school library issues books all year and then buys next year's stock from memory. The librarian has a feel for what moves, the English department has an opinion, and the order goes in. Nobody opens the issue register, because it is a year of loans and reading it would take a week.
The register knows things nobody in the building does. It knows which genre carries nearly half the borrowing and which shelf is barely touched. It knows that borrowing collapses in the examination months. It knows exactly which titles are borrowed far more often than the library has copies, which is the list the purchase order should be built from.
This project reads it out of MySQL and answers five questions in a second, including the two that cost money: what to buy, and who has not brought a book back.
A school librarian, and whoever signs the purchase order for next year's books.
Why it is worth doing on a computer
The purchase order is the reason. A school library's book budget is small and spent once a year, and at the moment it is spent on impressions. Setting each title's borrowing against the number of copies held turns that into a ranked list — and the top of the list turned out to be five titles with one copy each that were borrowed over seventy-five times.
The second reason is the overdue list, which is the job the register was created for and the one it does worst. Finding out which books are still out means reading every page and checking for a blank in the return column. It is done once a term at best, which is why books go missing. In pandas it is one condition, and it can be run every Monday.
Objectives
- To read a year of loans out of a MySQL database, joining three tables into one flat table for analysis
- To keep the books still out — the rows with NULL in the return date — instead of losing them to the cleaning
- To show when the library is used and when it empties
- To find which genres carry the borrowing and which shelves are barely touched
- To compare the classes, so a year group that has stopped reading can be found
- To measure how long a book is actually kept against the fourteen days allowed
- To rank titles by borrowing per copy held, which is the list the purchase order should follow
- To write out the overdue list and the demand list as CSV files the librarian can act on
2How the job is done today
Before writing anything it is worth asking how the work is handled at present, and where each of those answers falls short. These were examined:
Where all this data comes from, and it answers nothing. It is designed for writing down, not for reading back: every question above means turning every page.
Genuinely good, and it comes from the books handed over the counter. It cannot see borrowing per copy held, which is the figure that decides what to buy, and it cannot count.
Full library systems, used by colleges. They do all of this and are far larger than a school library needs, and installing and maintaining one is a real job.
An improvement on paper for recording. It cannot easily link a loan back to how many copies the library owns, and that link is the whole point of the second half of this project.
3Where the data came from
CBSE asks that any resource used in a project be suitably referenced, and for a data project that rule is not a formality — a figure with no source attached to it does not mean anything. This section is the one an examiner will ask about.
The library keeps three tables. `books` has one row per title with its genre and how many copies the library owns. `members` has one row per borrower. `issues` records who took which book, when, and when it came back.
The members table holds admission numbers and classes, and no names. That was decided before anything was written: a circulation report gets discussed in staff meetings and pinned to notice boards, and what a particular child reads is not something to put on a notice board. The analysis needs the class, not the person.
The database here is a LambdaLab sample — 39 titles, 196 members and 2,592 loans over a year — in a schema.sql that loads into MySQL in one command. For your own project use your school library's register with the librarian's permission, keep the admission numbers, and leave the names out for the same reason.
4The dataset
Three tables, and the NULL is the interesting part. A loan that has not come back has NULL in return_date, and every figure about overdue books is built from those NULLs. Anything that cleaned them away — a careless dropna, a WHERE that forgot them — would delete precisely the rows the librarian needs.
books — one row per title
| Field | Type | What it holds |
|---|---|---|
book_id | INT PRIMARY KEY | The title's id. What `issues` points at. |
title | VARCHAR(80) | The book's name. |
genre | VARCHAR(30) | Fiction, Science, Comics, Competitive Exams, and so on. |
copies | INT | How many copies the library owns. The denominator of the demand figure. |
price | DECIMAL(8,2) | What a copy costs, for replacing a lost one. |
members — one row per borrower
| Field | Type | What it holds |
|---|---|---|
member_id | INT PRIMARY KEY | The member's id. What `issues` points at. |
adm_no | VARCHAR(20) | Admission number. Deliberately not a name. |
class | VARCHAR(5) | VI to XII. |
issues — one row per loan
| Field | Type | What it holds |
|---|---|---|
issue_id | INT PRIMARY KEY | The loan's own id. |
book_id | INT, FOREIGN KEY | Which title. Must exist in `books`. |
member_id | INT, FOREIGN KEY | Which member. Must exist in `members`. |
issue_date | DATE | The day the book went out. |
return_date | DATE, may be NULL | The day it came back. NULL while it is still out. |
The tables, as the schema creates them
Creates the three tables and loads the sample rows — 39 titles, 196 members and 2,592 loans. Load it with one command before running the program. The whole file is 2,827 rows, 118.3 KB — too much to print here, so this is the structure it creates. The complete file comes with the download, and you can also take it on its own.
-- ---------------------------------------------------------------------
-- schema.sql  --  the school library's database
--
-- Three tables. `books` and `members` each hold one kind of fact once;
-- `issues` records who took which book and when it came back. A book still
-- on loan has NULL in return_date, and that NULL is what makes the "still
-- out" query possible.
--
-- Load it with:   mysql -u root -p < schema.sql
-- ---------------------------------------------------------------------

CREATE DATABASE IF NOT EXISTS lambdalab_library;
USE lambdalab_library;

DROP TABLE IF EXISTS issues;
DROP TABLE IF EXISTS books;
DROP TABLE IF EXISTS members;

CREATE TABLE books (
    book_id  INT PRIMARY KEY,
    title    VARCHAR(80)  NOT NULL,
    genre    VARCHAR(30)  NOT NULL,
    copies   INT          NOT NULL,   -- how many the library owns
    price    DECIMAL(8,2) NOT NULL
);

CREATE TABLE members (
    member_id INT PRIMARY KEY,
    adm_no    VARCHAR(20) NOT NULL,   -- admission number, not a name
    class     VARCHAR(5)  NOT NULL
);

CREATE TABLE issues (
    issue_id    INT  PRIMARY KEY,
    book_id     INT  NOT NULL,
    member_id   INT  NOT NULL,
    issue_date  DATE NOT NULL,
    return_date DATE,                 -- NULL while the book is still out
    FOREIGN KEY (book_id)   REFERENCES books(book_id),
    FOREIGN KEY (member_id) REFERENCES members(member_id)
);
The rows themselves follow in the same file, as ordinary INSERT statements. These are the first few:
INSERT INTO books VALUES
(1, 'Wings of Fire', 'Fiction', 1, 430.00),
(2, 'The Guide', 'Fiction', 4, 213.00),
(3, 'Train to Pakistan', 'Fiction', 1, 212.00),
(4, 'Malgudi Days', 'Fiction', 1, 473.00),
(5, 'The Room on the Roof', 'Fiction', 6, 620.00),5Cleaning the data
Real data arrives with mistakes in it, and this dataset has the ones real data actually has. What was wrong, how much of it there was, and what the program does about each — because how a problem is handled changes the answer, and a report has to say which choice it made.
pd.to_datetime(..., errors="coerce") turns the NULLs into NaT rather than stopping with an error, so those rows survive into the analysis. They are the overdue list — losing them would delete exactly the rows that matter.
The days-kept figures use a frame with those rows dropped, and the overdue figures use only those rows. Two questions, two subsets, one file — instead of one cleaning step that would have broken one of them.
to_datetime on each. MySQL hands back date objects and SQLite text, and the program should not care which is behind it.
The demand table joins books to the borrowing counts and fills the gaps with 0, so a title never taken out shows up as a zero row instead of not existing. It happened not to occur this year; the code still handles it, because next year it might.
6What the program does
- Connects to MySQL and pulls a year of loans into pandas with a single three-table JOIN
- Keeps the loans that are still out, rather than cleaning the NULLs away
- Charts borrowing month by month and names the busiest and quietest months
- Ranks genres by borrowing and gives each one's share
- Compares the seven classes
- Measures how long a book is kept, against the fourteen-day limit, and counts the late returns
- Finds the books overdue right now, from the loans with no return date
- Ranks titles by borrowing per copy held — the list a purchase order should follow
- Writes the overdue list and the demand list out as CSV files
The pandas and pyplot it is built from
| Call | Where | What it is for |
|---|---|---|
mysql.connector.connect() | step 1 | Opens the database from Python |
JOIN ... JOIN ... | step 2 | Three tables into one flat table in a single query |
pd.read_sql(query, con) | step 2 | Sends the SQL and gets a DataFrame back |
pd.to_datetime(s, errors="coerce") | step 3 | A NULL becomes NaT instead of stopping the program |
Series.isnull().sum() | step 3 | Counts the loans still out |
df.dropna(subset=[...]).copy() | step 4 | The returned loans, as a frame of their own |
df[df[c].isnull()] | step 4 | The other half — the loans still out |
(a - b).dt.days | step 4 | How many days a book was kept |
Series.dt.to_period("M") | step 5 | Groups a whole month together |
df.groupby(col)[id].count() | step 5 | Counting rows rather than adding a column up |
Series.reindex(order) | step 5 | Classes in school order, not alphabetical |
DataFrame.set_index().join() | step 6 | Puts the borrowing counts beside the copies held |
DataFrame.fillna(0) | step 6 | A title nobody borrowed stays in the table as a zero |
plt.axvline() | chart 4 | The dashed line at the fourteen-day limit |
DataFrame.to_csv() | step 7 | Writes the overdue and demand lists out |
7Technical details
| Language | Python 3 |
| Where the data lives | MySQL, read into pandas through mysql-connector-python |
| Libraries |
|
8How it works, step by step
mysql.connector.connect() opens the library database.
One read_sql with a three-table JOIN brings every loan together with its title, genre, copies and the borrower's class.
to_datetime on both dates, with errors="coerce" on the return date so the loans still out become NaT and survive.
One frame of returned loans for the days-kept figures, one of unreturned loans for the overdue list. Neither question can use the other's rows.
groupby() gives the monthly counts, the genre and class breakdowns, and the ranking by title.
The borrowing counts are joined back onto the books table so each title's borrowing can be divided by the copies held.
Five charts — a line, two bars, a histogram and a horizontal bar — each saved with savefig().
9Source code
The whole program. Every chart further down this page was drawn by this listing, and every figure quoted came out of running it.
# ---------------------------------------------------------------------------
# circulation_analysis.py
#
# A school library issues books all year and nobody ever looks at the register
# afterwards. This program reads it out of MySQL and answers the questions the
# librarian has to answer before the next purchase order goes in:
#
#   1. When is the library actually used, and when is it empty?
#   2. What do children read, and which shelf is dead?
#   3. Which classes use the library, and which have stopped?
#   4. How long is a book kept, and how many are overdue right now?
#   5. Which titles are worth buying more copies of?
#
# The library keeps admission numbers, not names. That is deliberate: a report
# that goes on a notice board should not carry a child's name against what
# they read.
# ---------------------------------------------------------------------------

import mysql.connector
import pandas as pd
import matplotlib.pyplot as plt

TODAY = pd.Timestamp("2026-03-31")      # the day the register was read
LOAN_DAYS = 14                          # how long a book may be kept

# --- 1. Connect and read -------------------------------------------------
con = mysql.connector.connect(
    host="localhost",
    user="root",
    password="your_password_here",
    database="lambdalab_library",
)

# One JOIN pulls the three tables into a single flat table, which is the shape
# pandas works best with. Everything after this is ordinary DataFrame work.
issues = pd.read_sql(
    "SELECT i.issue_id, i.issue_date, i.return_date, "
    "       b.title, b.genre, b.copies, m.class "
    "FROM issues i "
    "JOIN books b   ON i.book_id   = b.book_id "
    "JOIN members m ON i.member_id = m.member_id",
    con)
books = pd.read_sql("SELECT * FROM books", con)
con.close()

print("Issues in the register :", len(issues))
print("Titles in the library  :", len(books))
print()

issues["issue_date"] = pd.to_datetime(issues["issue_date"])
# errors="coerce" turns the NULLs of books still out into NaT rather than
# stopping with an error. Those rows have to survive: they are the overdue list.
issues["return_date"] = pd.to_datetime(issues["return_date"], errors="coerce")

still_out = issues["return_date"].isnull().sum()
print("Books still out today  :", still_out)
print()

# --- 2. Question 1: when is the library used? ----------------------------
issues["month"] = issues["issue_date"].dt.to_period("M").astype(str)
monthly = issues.groupby("month")["issue_id"].count()

print("--- Books issued, month by month ---")
print(monthly)
print()
print("Busiest month :", monthly.idxmax(), "with", monthly.max(), "issues")
print("Quietest month:", monthly.idxmin(), "with", monthly.min(), "issues")
print()

plt.figure(figsize=(9, 4.5))
plt.plot(monthly.index, monthly.values, marker="o", color="#e07b39")
plt.title("Books issued, month by month")
plt.xlabel("Month")
plt.ylabel("Books issued")
plt.xticks(rotation=45)
plt.grid(True, linestyle="--", alpha=0.5)
plt.tight_layout()
plt.savefig("chart1_monthly_issues.png")
plt.close()

# --- 3. Question 2: what gets read? --------------------------------------
by_genre = issues.groupby("genre")["issue_id"].count().sort_values(ascending=False)

print("--- Issues by genre ---")
print(by_genre)
print()
print("Share of all issues (%):")
print((by_genre / by_genre.sum() * 100).round(1))
print()

plt.figure(figsize=(8.5, 4.5))
plt.bar(by_genre.index, by_genre.values, color="#4c9f70")
plt.title("Books issued, by genre")
plt.xlabel("Genre")
plt.ylabel("Times issued in the year")
plt.xticks(rotation=25)
plt.tight_layout()
plt.savefig("chart2_genres.png")
plt.close()

# --- 4. Question 3: which classes use it? --------------------------------
order = ["VI", "VII", "VIII", "IX", "X", "XI", "XII"]
by_class = issues.groupby("class")["issue_id"].count().reindex(order)

print("--- Issues by class ---")
print(by_class)
print()

plt.figure(figsize=(8, 4.5))
plt.bar(by_class.index, by_class.values, color="#3b7dd8")
plt.title("Books issued, by class")
plt.xlabel("Class")
plt.ylabel("Books issued in the year")
plt.tight_layout()
plt.savefig("chart3_classes.png")
plt.close()

# --- 5. Question 4: how long is a book kept? -----------------------------
returned = issues.dropna(subset=["return_date"]).copy()
returned["days_kept"] = (returned["return_date"] - returned["issue_date"]).dt.days

print("--- Days a book is kept (returned books only) ---")
print(returned["days_kept"].describe().round(1))
print()
# The guard matters: a register in which nothing has been returned yet is
# perfectly possible at the start of a term, and without it the program stops
# with ZeroDivisionError on this line rather than saying so.
if len(returned) == 0:
    print("Returned late : nothing has been returned yet")
else:
    late = returned[returned["days_kept"] > LOAN_DAYS]
    print("Returned late :", len(late), "of", len(returned),
          "(", round(len(late) / len(returned) * 100, 1), "% )")

# A book still out is overdue if it went out more than LOAN_DAYS ago.
out = issues[issues["return_date"].isnull()].copy()
out["days_out"] = (TODAY - out["issue_date"]).dt.days
overdue = out[out["days_out"] > LOAN_DAYS]
print("Overdue right now:", len(overdue))
print()

if len(returned) > 0:
    plt.figure(figsize=(8, 4.5))
    plt.hist(returned["days_kept"].values, bins=14, color="#a05fc0", edgecolor="white")
    plt.axvline(LOAN_DAYS, color="#c0392b", linestyle="--", label="14-day limit")
    plt.title("How long a book is kept before it comes back")
    plt.xlabel("Days kept")
    plt.ylabel("Number of loans")
    plt.legend()
    plt.tight_layout()
    plt.savefig("chart4_days_kept.png")
    plt.close()

# --- 6. Question 5: what should the library buy? -------------------------
by_title = issues.groupby("title")["issue_id"].count().sort_values(ascending=False)

print("--- Ten most-borrowed titles ---")
print(by_title.head(10))
print()

# A title issued far more often than it has copies is one children wait for.
demand = books.set_index("title")[["copies"]].join(
    by_title.rename("times_issued")).fillna(0)
demand["times_issued"] = demand["times_issued"].astype(int)
demand["per_copy"] = (demand["times_issued"] / demand["copies"]).round(1)

print("--- Most in demand for the number of copies held ---")
print(demand.sort_values("per_copy", ascending=False).head(8))
print()
never = demand[demand["times_issued"] == 0]
print("Titles nobody borrowed all year:", len(never))
if len(never) > 0:
    print(list(never.index))
print()

top10 = by_title.head(10)[::-1]
plt.figure(figsize=(8.5, 5))
plt.barh(top10.index, top10.values, color="#c9772f")
plt.title("Ten most-borrowed titles")
plt.xlabel("Times issued in the year")
plt.tight_layout()
plt.savefig("chart5_top_titles.png")
plt.close()

# --- 7. The lists the librarian prints -----------------------------------
overdue[["title", "class", "issue_date", "days_out"]].sort_values(
    "days_out", ascending=False).to_csv("overdue.csv", index=False)
demand.sort_values("per_copy", ascending=False).to_csv("demand.csv")

print("Charts saved  : chart1_monthly_issues.png .. chart5_top_titles.png")
print("Lists saved : overdue.csv, demand.csv")The full report as a PDF, ready to print and fill in. Or the working project as a zip — the program, the dataset, the charts and a README.
10Sample output
A real run, reproduced exactly as it appeared. Nothing below was typed by hand — it is the transcript of the program above against the dataset in section 4.
Issues in the register : 2592
Titles in the library  : 39

Books still out today  : 26

--- Books issued, month by month ---
month
2025-04    264
2025-05     90
2025-06    109
2025-07    288
2025-08    270
2025-09    303
2025-10    254
2025-11    261
2025-12    290
2026-01    284
2026-02     95
2026-03     84
Name: issue_id, dtype: int64

Busiest month : 2025-09 with 303 issues
Quietest month: 2026-03 with 84 issues

--- Issues by genre ---
genre
Fiction              1144
Science               402
Comics                375
Competitive Exams     237
Biography             176
History               133
Reference              76
Poetry                 49
Name: issue_id, dtype: int64

Share of all issues (%):
genre
Fiction              44.1
Science              15.5
Comics               14.5
Competitive Exams     9.1
Biography             6.8
History               5.1
Reference             2.9
Poetry                1.9
Name: issue_id, dtype: float64

--- Issues by class ---
class
VI      349
VII     356
VIII    401
IX      355
X       367
XI      375
XII     389
Name: issue_id, dtype: int64

--- Days a book is kept (returned books only) ---
count    2566.0
mean       10.7
std         5.7
min         1.0
25%         6.0
50%        11.0
75%        15.0
max        32.0
Name: days_kept, dtype: float64

Returned late : 681 of 2566 ( 26.5 % )
Overdue right now: 4

--- Ten most-borrowed titles ---
title
Godaan                     131
The Guide                  124
Interpreter of Maladies    118
Wings of Fire              117
The Blue Umbrella          115
Train to Pakistan          112
The White Tiger            109
Malgudi Days               107
Chandrakanta               106
The Room on the Roof       105
Name: issue_id, dtype: int64

--- Most in demand for the number of copies held ---
                           copies  times_issued  per_copy
title
Wings of Fire                   1           117     117.0
Train to Pakistan               1           112     112.0
The White Tiger                 1           109     109.0
Malgudi Days                    1           107     107.0
The Selfish Gene                1            75      75.0
Godaan                          2           131      65.5
Interpreter of Maladies         2           118      59.0
The Diary of a Young Girl       1            51      51.0

Titles nobody borrowed all year: 0

Charts saved  : chart1_monthly_issues.png .. chart5_top_titles.png
Lists saved : overdue.csv, demand.csvschema.sql into MySQL and change the user and password in the connect() call to your own.Running it also wrote overdue.csv — 4 rows. This is the head of it:
title,class,issue_date,days_out
Ashoka,XI,2026-03-09,22
My Experiments with Truth,VII,2026-03-16,15
Godaan,VIII,2026-03-16,15
Cosmos,VIII,2026-03-16,15
Running it also wrote demand.csv — 39 rows. This is the head of it:
title,copies,times_issued,per_copy
Wings of Fire,1,117,117.0
Train to Pakistan,1,112,112.0
The White Tiger,1,109,109.0
Malgudi Days,1,107,107.0
The Selfish Gene,1,75,75.0
Godaan,2,131,65.5
Interpreter of Maladies,2,118,59.0
The Diary of a Young Girl,1,51,51.0
Silent Spring,2,69,34.511The charts, and what each one says
CBSE asks for appropriate charts, and the word doing the work in that phrase is appropriate. A line for something that moves in order, a bar to compare things that do not, a histogram for the shape of one column of numbers. Each chart below says which it is, why that kind was chosen, and what it turned out to show.
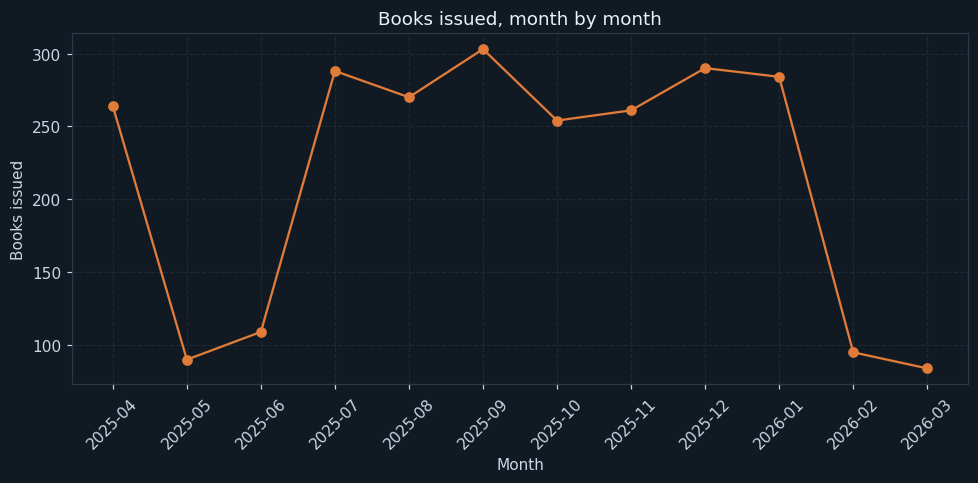
Books issued in each month of the school year. A line, because the months are in order and the collapses are what the chart is for.
Borrowing runs at 250 to 300 books a month and then falls off a cliff twice: to 90 in May and 109 in June, and to 95 in February and 84 in March.
Those are the summer break and the examination months, and together they are four months of the year in which the library is nearly empty. It is worth saying what that does and does not mean. It does not mean children stopped reading — it means the library was shut or they were revising. But it does mean any library activity, any book fair, any reading week, has eight months to happen in, and February is the worst possible date for it.
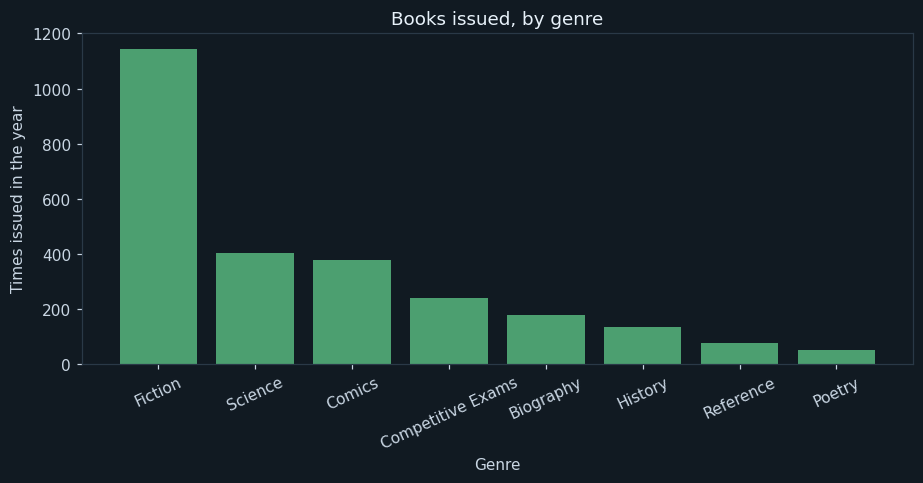
Loans by genre for the year, largest first. Bars, because genres have no natural order and the comparison is between heights.
Fiction is 1,144 loans — 44.1 per cent of everything borrowed, and nearly three times the next genre. Science follows at 15.5 per cent and Comics at 14.5.
The bottom of the chart is the useful end. Poetry is 49 loans in a year, 1.9 per cent, and Reference is 76. The reference shelf is probably fine — a dictionary is used in the library and never issued, so it does not show up here. Poetry has no such excuse, and 49 loans across 196 members is a shelf the library is maintaining for almost nobody.
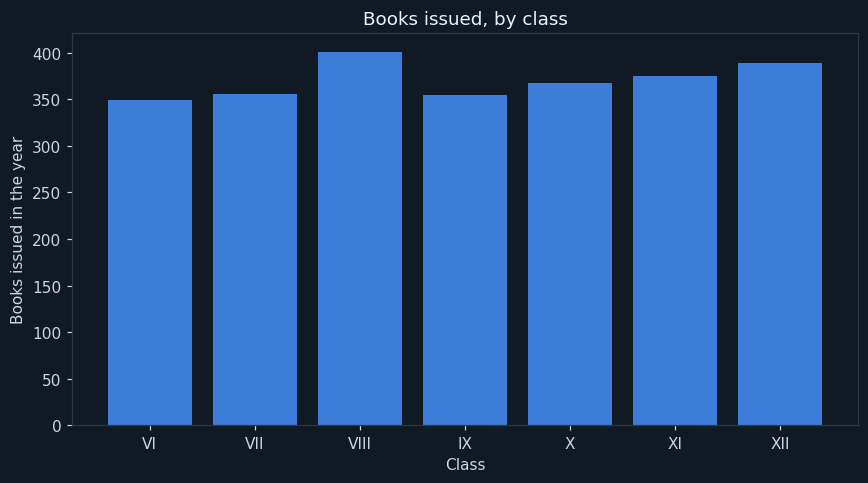
Loans by class, from VI to XII in school order rather than alphabetical. That ordering is done deliberately with reindex, because "IX" and "VI" sort in an order that means nothing.
The classes are remarkably level: from 349 loans in Class VI to 401 in Class VIII, with everything else between. No year group has stopped using the library.
That is a negative finding and it is worth reporting as one. The librarian expected Class XII to have dropped away under board pressure and it has not — 389 loans, the second highest in the school. A finding that contradicts an expectation is worth as much as one that confirms it, and this chart exists to have made the check.
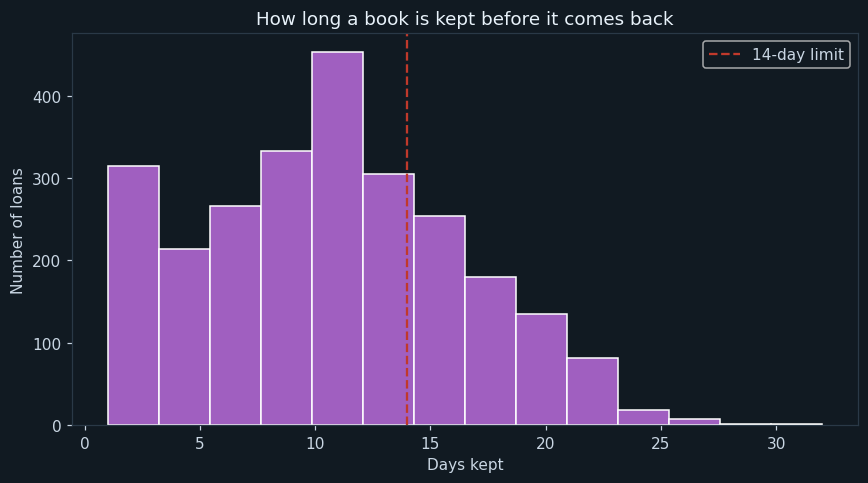
Every returned loan sorted by how many days it was out, with a dashed line at the fourteen-day limit. Anything to the right of that line came back late.
The median loan is 11 days and the quarter mark 6, so most books come back comfortably inside the limit. But 681 of 2,566 returned loans — 26.5 per cent — came back late, and the longest was out for 32 days.
A quarter of all loans breaking the rule is not really a discipline problem; it is a sign the rule does not match how the books are used. Either the fortnight is too short for the way children read, or nothing happens when it is missed. Both are decisions for the school, and the chart is what turns "children keep books too long" into a number worth discussing.
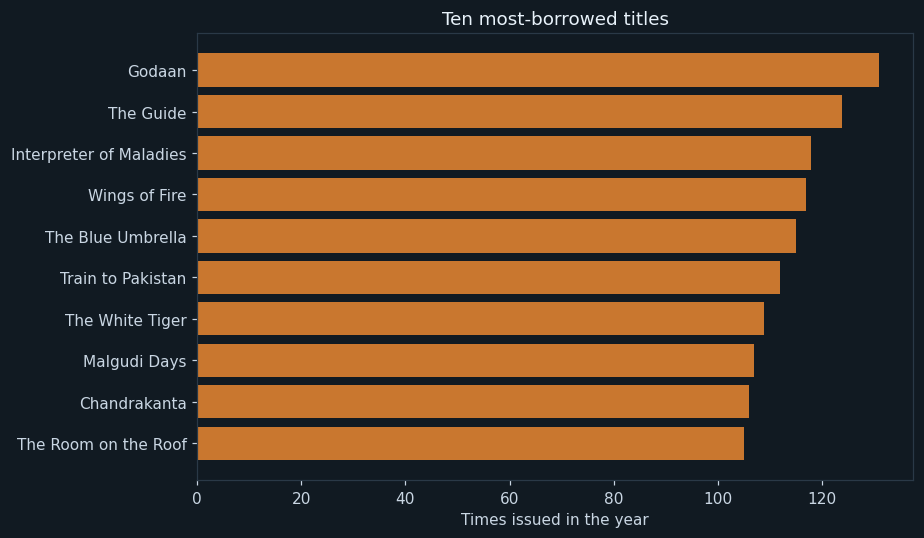
The ten titles issued most often in the year, biggest at the top. Horizontal bars, because book titles are long.
Godaan leads with 131 loans, then The Guide at 124 and Interpreter of Maladies at 118. Every one of the top ten is fiction, which is the genre chart again at one level finer.
The list beside it matters more, and it is a different list. Dividing each title's borrowing by the copies the library owns puts Wings of Fire at the top: 117 loans against a single copy. Train to Pakistan, The White Tiger and Malgudi Days are the same story — one copy each, borrowed over a hundred times. Godaan is borrowed most often in absolute terms and already has two copies. The purchase order should follow the second list, not the first, and that distinction is the most useful thing this project produces.
12What the analysis found
- 2,592 loans in the year, and 26 books were still out on the day the register was read.
- Fiction is 44.1 per cent of all borrowing; Poetry is 1.9 per cent.
- Borrowing falls from about 280 a month to 84–95 in the examination months and 90 in the summer break.
- All seven classes borrow at much the same rate, from 349 to 401 loans; Class XII has not dropped away.
- The median book is kept 11 days, but 26.5 per cent of returns are past the fourteen-day limit.
- Four overdue books are outstanding right now.
- Five titles with one copy each were borrowed 75 to 117 times — the strongest case in the file for buying more copies.
What should be done about them
This is the part that turns an analysis into a project. A chart that nobody acts on is a picture; a recommendation somebody can argue with is a result.
- Buy second copies of Wings of Fire, Train to Pakistan, The White Tiger and Malgudi Days before buying anything new.
- Run the overdue list every Monday. It is one condition and it takes a second.
- Do not schedule the reading week in February or March.
- Look at the poetry shelf. Either promote it deliberately or accept that the space is better used.
- Decide about the fourteen-day rule. A quarter of loans breaking it means the rule or the enforcement needs changing, not the children.
- Keep the register in the database rather than the book. Everything above took a second and the register took a year to fill.
13Testing
Every case below was actually executed and its result recorded as it appeared — including the ones expected to fail. Each one builds a small dataset of its own and runs the whole program against it.
| Test case | Expected | Actual | Result |
|---|---|---|---|
| The full register, 2592 loans | Issues in the register : 2592 | Issues in the register : 2592 | Pass |
| Loans with no return date survive the cleaning | Books still out today : 26 | Books still out today : 26 | Pass |
| Late returns counted against the 14-day limit | Returned late : 681 of 2566 ( 26.5 % ) | Returned late : 681 of 2566 ( 26.5 % ) | Pass |
| And four of the books still out are overdue | Overdue right now: 4 | Overdue right now: 4 | Pass |
| A loan still out is not dropped from the register | Books still out today : 1 | Books still out today : 1 | Pass |
| ...and is not counted among the returned loans | count 1.0 | count 1.0 | Pass |
| Exactly 14 days is on time; 15 is late | Returned late : 1 of 2 ( 50.0 % ) | Returned late : 1 of 2 ( 50.0 % ) | Pass |
| A book out for exactly 14 days is not yet overdue | Overdue right now: 1 | Overdue right now: 1 | Pass |
| The most-borrowed title is Godaan, with 4 loans | Godaan 4 | Godaan 4 | Pass |
| ...but the title most in demand per copy is Wings of Fire | Wings of Fire 1 3 3.0 | Wings of Fire 1 3 3.0 | Pass |
| Titles nobody borrowed are reported, not silently lost | Titles nobody borrowed all year: 2 | Titles nobody borrowed all year: 2 | Pass |
Two kinds of case are in there on purpose. The boundary cases test the edge of a rule, where a program is most often wrong by one. The failure cases check that it stops cleanly and says why, instead of quietly producing a wrong answer.
14Advantages
Set against the ways the job is done today:
- The overdue list stops being an end-of-term job and becomes a weekly one
- The purchase order can follow borrowing per copy held instead of impressions
- A title's details are stored once, so nothing can disagree with itself
- Loans still out are kept rather than cleaned away, which is where a careless version of this would go wrong
- The library's own data answers questions about it, without buying a library system
- Children's names appear nowhere in the analysis
15Limitations and future scope
What this version cannot tell you
A data project should be honest about the limits of its own data. Each of these is a reason for one of the additions below:
- One copy is not distinguished from another, so a damaged or lost copy cannot be traced
- Books read inside the library are never issued, so the reference shelf looks quieter than it is
- There is no reservation, so a child who wanted a book that was out leaves no trace at all
- Fines are not recorded, so lateness has no cost attached in the data
- A year of one school's borrowing says nothing about children in general
What to add next
This is also where you make the project yours. Take one or two of these, or something nobody here thought of:
- Record a reservation, so demand from children who could not get a book is visible too
- Add a barcode on the membership card and issue at the counter by scanning it
- Email a reminder two days before a book is due, rather than chasing it afterwards
- Track a lost copy and use the price column to bill for it
- Compare this year's genre split with last year's
- Show borrowing per member of each class, which is fairer than a raw count when the classes differ in size
16What you may have to teach yourself
CBSE expects some self-learning in a project and says so. For this one, that means:
- Joining three tables in one query, and why the issues table stores ids rather than titles and names
- NULL, and how it arrives in pandas as NaT or NaN. errors="coerce" is the line that makes the overdue half of this project possible.
- Splitting one file into two frames for two questions, instead of one cleaning step that ruins one of them
- join() on a DataFrame, which is how the borrowing counts get set beside the copies held
17Conclusion
The program does what it set out to do. Three tables come out of MySQL, five questions are answered in a second, and the librarian ends up with two files to act on rather than a register to read.
The finding worth the project is the difference between two rankings that look like the same question. Godaan is the most borrowed book in the school and the library already has two copies of it. Wings of Fire was borrowed 117 times against a single copy — every one of those borrowings is a child who got it and, behind them, others who did not. Ranked by borrowing, Godaan is first. Ranked by borrowing per copy, it is sixth. Only one of those two lists is a purchase order.
The part that had to be got right was the NULLs. Twenty-six loans have no return date because those books are still out, and the obvious cleaning step — drop the rows with a missing value — would have deleted exactly the rows the overdue list is made of. The program deliberately keeps them, splits the file into two frames, and answers the two questions from different halves of it.
18References
Every report needs a bibliography, and a data project needs its data source at the top of it.
- The issue register of a school library, one year, with the librarian's permission. The database shipped here is a LambdaLab sample standing in for it and carries admission numbers rather than names.
- MySQL 8.0 Reference Manual, JOIN syntax — https://dev.mysql.com/doc/refman/8.0/en/join.html
- MySQL Connector/Python Developer Guide — https://dev.mysql.com/doc/connector-python/en/
- pandas user guide, “Working with missing data” — https://pandas.pydata.org/docs/user_guide/missing_data.html
- Informatics Practices, Class XII — the NCERT / CBSE prescribed textbook, for the chapters on data handling with pandas, database query using SQL, and data visualisation
- pandas documentation — https://pandas.pydata.org/docs/
- Matplotlib documentation — https://matplotlib.org/stable/
- CBSE Senior School Curriculum, Informatics Practices (Subject Code 065) — the project guidelines this report follows
- LambdaLab — https://www.lambdalab.in