A Year of Our City's Weather
Three hundred and sixty-five days of temperature, rain and humidity — and what the year actually looks like when you stop remembering it.
1Introduction: the problem it solves
Everybody has an opinion about the weather and almost nobody has the figures. Ask when the monsoon arrives and you get a fortnight's range. Ask how much of the year's rain falls in it and you get a guess. Ask whether it rained more this year than last and the argument goes on until somebody changes the subject.
Meanwhile the readings exist. A weather station records the day's maximum, its minimum, the rainfall and the humidity, every day, and has done for years. Three hundred and sixty-five rows of five columns hold the answer to every one of those questions.
This project reads a year of them and asks five things a person cannot answer from memory: what shape the year has, when the rain really comes, whether it arrives spread out or in a few violent days, what a normal day is, and whether the humidity everybody complains about actually tracks the rain.
A geography class, a school science exhibition, a farmer deciding when to sow, or anybody who has ever argued about whether this summer was worse than the last one.
Why it is worth doing on a computer
The reason to compute this is not speed. It is that human memory of weather is unreliable in a specific, measurable way: it remembers extremes and forgets ordinary days. Ask anybody how many days last year were over 40 degrees and the answer will be far too high, because those are the days that stuck.
There is a second reason, and it is the one that makes this project worth doing rather than reading about. Rainfall does not arrive in a steady drizzle spread through the monsoon — it arrives in a few enormous days. Nobody believes that until they see the number, and it changes what a town should build. That figure cannot be felt; it has to be counted.
Objectives
- To read a year of daily weather readings from a single CSV file
- To handle two different kinds of blank correctly, because in this file they mean different things
- To show the shape of the year in temperature, with the day-night gap visible
- To measure how much of the year's rain falls in the monsoon months, and how much of it falls on a handful of days
- To describe an ordinary day, and count how many days are genuinely extreme
- To test whether humidity and rainfall really move together
- To write a month-by-month summary out as a table that can be pasted into a report
2How the job is done today
Before writing anything it is worth asking how the work is handled at present, and where each of those answers falls short. These were examined:
How the question is usually answered, and it is wrong in a predictable direction. Extremes stick and ordinary days do not, so the remembered year is hotter, wetter and more dramatic than the recorded one.
Excellent for tomorrow and useless for this. It shows a forecast, not a year, and it will not tell you what fraction of last year's rain fell on ten days.
Authoritative, and the right thing to compare against. They are averages over thirty years, so they describe a typical year and cannot say anything about this one.
Workable. Monthly totals are easy; counting rainy days, measuring what the ten heaviest contributed, and correlating two columns each take a fresh set of formulas, and the chart has to be rebuilt every time.
3Where the data came from
CBSE asks that any resource used in a project be suitably referenced, and for a data project that rule is not a formality — a figure with no source attached to it does not mean anything. This section is the one an examiner will ask about.
Weather readings belong to whoever recorded them, and this is the project where that matters most. Every figure in a weather report has a source, and a report that does not name it has failed the CBSE guideline about referencing resources — not as a formality, but because a rainfall figure with no station attached to it means nothing.
There are three honest places to get real readings. The India Meteorological Department publishes station data; data.gov.in carries district-wise rainfall and temperature series under an open licence; and many schools have their own weather station whose register the science department keeps. Any of the three is fine. Name the one you used, give the station, give the dates, give the link, and check the licence lets you republish it.
The file shipped here is none of those. It is a LambdaLab sample of 365 rows, generated to behave like a north-Indian plains city — a May peak around 39 degrees, a January around 22, and about 776 mm of rain concentrated in the monsoon. It exists so the program can be run and marked before you have downloaded anything, and it must not be presented as a record of any real place.
4The dataset
One file in, one file out. weather.csv is one row per day, which is how a station's register is already written. The two blank columns in it are the interesting part: a blank temperature and a blank rainfall do not mean the same thing, and the program treats them differently on purpose.
weather.csv — one row per day
| Field | Type | What it holds |
|---|---|---|
date | date (YYYY-MM-DD) | The day. Written this way round so it sorts correctly. |
max_temp | decimal | The day's highest temperature in Celsius. Blank if the station did not report. |
min_temp | decimal | The night's lowest temperature in Celsius. Blank on the same days. |
rainfall_mm | decimal | Rain in millimetres. 0.0 on a dry day; blank when nobody wrote in the column. |
humidity | integer | Relative humidity as a percentage. |
The first few lines of weather.csv
| date | max_temp | min_temp | rainfall_mm | humidity |
|---|---|---|---|---|
2025-07-01 | 36.9 | 27.9 | 34.4 | 95 |
2025-07-02 | 35.9 | 24.7 | 0.0 | 72 |
2025-07-03 | 31.5 | 25.6 | 0.0 | 78 |
2025-07-04 | 31.9 | 26.6 | 30.0 | 98 |
2025-07-05 | 31.0 | 26.4 | 5.1 | 79 |
2025-07-06 | 39.8 | 25.8 | 0.0 | 88 |
2025-07-07 | 34.7 | 27.7 | 0.0 | 82 |
2025-07-08 | 34.0 | 28.1 | 0.0 | 76 |
Inside weather.csv
A year of daily readings — 365 rows — with five days the station did not report and three where the rain column was left empty. The whole file is 365 rows, 9.9 KB — too much to print here, so this is the head of it. The complete file comes with the download, and you can also take it on its own.
date,max_temp,min_temp,rainfall_mm,humidity
2025-07-01,36.9,27.9,34.4,95
2025-07-02,35.9,24.7,0.0,72
2025-07-03,31.5,25.6,0.0,78
2025-07-04,31.9,26.6,30.0,98
2025-07-05,31.0,26.4,5.1,79
2025-07-06,39.8,25.8,0.0,88
2025-07-07,34.7,27.7,0.0,82
2025-07-08,34.0,28.1,0.0,765Cleaning the data
Real data arrives with mistakes in it, and this dataset has the ones real data actually has. What was wrong, how much of it there was, and what the program does about each — because how a problem is handled changes the answer, and a report has to say which choice it made.
The day is left out of every temperature figure and stays in the file for everything else. Dropping the whole row would have taken its rainfall with it, and rain that fell on a day the thermometer failed still fell. Filling the temperature in from the month's average would invent a measurement.
fillna(0). At this station a blank rain column means nothing fell; that is the convention the observer works to. Dropping these days instead would throw away three days of perfectly good temperature and humidity.
This is the decision the whole project turns on. Treat them the same way and one of the two is wrong: either three real dry days vanish from the rainy-day count, or five days with no thermometer reading get an invented temperature. Nothing in the file says which is which — the observer does.
reindex on the list Jan..Dec. Without it a chart of the year begins at April and ends at September, which looks like a data error and is a sorting one.
6What the program does
- Reads a year of daily weather readings from one CSV file
- Treats a missing temperature and a missing rainfall figure differently, and keeps a day's rain even when its thermometer reading is missing
- Charts the average daily maximum and minimum through the year on one pair of axes
- Totals rainfall by month and works out what share the monsoon carries
- Counts rainy days, finds the wettest single day, and measures what the heaviest days contributed
- Describes an ordinary day and counts the days at 40 degrees or above and the nights at 10 or below
- Correlates humidity with rainfall, and compares humidity on rainy days against dry ones
- Writes a month-by-month summary table out as a CSV
The pandas and pyplot it is built from
| Call | Where | What it is for |
|---|---|---|
pd.read_csv(..., parse_dates=) | step 1 | Loads the readings with the date column as real dates |
Series.fillna(0) | step 2 | A blank rain column at this station means no rain |
df.dropna(subset=[...]) | step 2 | Builds a second frame for the temperature work only, so a failed thermometer costs no rainfall |
Series.dt.strftime("%b") | step 3 | Jan, Feb, Mar instead of 1, 2, 3 |
df.groupby("month")[[a, b]].mean() | step 4 | Two columns averaged in one call |
DataFrame.reindex(order) | step 4 | Puts the months into calendar order, not alphabetical |
df[df["rainfall_mm"] > 0] | step 5 | Boolean indexing — just the rainy days |
df.loc[df[c].idxmax(), "date"] | step 5 | The date of the biggest reading, not the reading itself |
Series.describe() | step 5 | Count, mean, spread and quartiles of the daily maximum |
Series.corr(other) | step 7 | How closely humidity and rainfall move together |
plt.plot() twice on one figure | chart 1 | Two lines on one pair of axes, with the gap between them meaningful |
plt.legend() | charts 1, 4 | Names the lines, without which two lines are unreadable |
plt.hist() | chart 4 | The spread of one column across the year |
pd.DataFrame({...}) | step 8 | Five Series assembled into the summary table |
DataFrame.to_csv() | step 8 | Writes that table out |
7Technical details
| Language | Python 3 |
| Where the data lives | A plain CSV file, read into pandas |
| Libraries |
|
8How it works, step by step
read_csv() with parse_dates loads weather.csv and turns the date column into real dates, which is what makes .dt.strftime work later.
Missing rainfall is filled with zero. A missing temperature does not remove the day — it only keeps it out of the temperature figures, through a second frame. Both counts are printed.
A month column is added with .dt.strftime("%b"), giving Jan, Feb, Mar rather than 1, 2, 3 — which reads far better on a chart.
groupby("month") with reindex on the calendar order gives the monthly averages and totals in the order a year actually happens in.
Boolean conditions pick out the rainy days, the heavy days, the days above 40 and the nights below 10.
Five charts — two lines, two bars and a histogram — each saved with savefig().
9Source code
The whole program. Every chart further down this page was drawn by this listing, and every figure quoted came out of running it.
# ---------------------------------------------------------------------------
# weather_analysis.py
#
# One year of daily weather readings for our city, and the questions people
# ask about the weather but usually answer from memory:
#
#   1. How does the temperature move through the year?
#   2. When does the rain actually come, and how much of it?
#   3. Is the rain spread out, or does it arrive in a few heavy days?
#   4. What is a normal summer day, and how often is it extreme?
#   5. Do humid days and rainy days go together?
#
# IMPORTANT: weather data belongs to whoever recorded it. The file used here
# is a LambdaLab sample. If you use real readings — from IMD, data.gov.in or
# your school's own weather station — say so in the report and give the link.
# ---------------------------------------------------------------------------

import pandas as pd
import matplotlib.pyplot as plt

# --- 1. Read -------------------------------------------------------------
df = pd.read_csv("weather.csv", parse_dates=["date"])
print("Rows read        :", len(df))
print("From             :", df["date"].min().date(), "to", df["date"].max().date())
print()

# --- 2. Clean ------------------------------------------------------------
# The two kinds of blank in this file mean different things, and treating
# them the same would be wrong.
#
#   * A blank temperature means the station did not report. There is no
#     reading, so the day is dropped from anything about temperature.
#   * A blank rainfall means nobody wrote anything in the column, which for
#     this station means no rain fell. That is filled with 0.
no_temp = df["max_temp"].isnull().sum()
no_rain = df["rainfall_mm"].isnull().sum()
df["rainfall_mm"] = df["rainfall_mm"].fillna(0)

# The month each reading belongs to, added before anything is split off so
# that both frames below carry it. strftime("%b") gives Jan, Feb, ... which
# reads better on a chart than 1, 2, 3.
df["month"] = df["date"].dt.strftime("%b")
order = ["Jan", "Feb", "Mar", "Apr", "May", "Jun",
         "Jul", "Aug", "Sep", "Oct", "Nov", "Dec"]

# The days with no thermometer reading are NOT thrown out of the file. They
# are only kept out of the temperature figures, and `temps` is the frame that
# does that. Dropping them from df altogether would have taken their rainfall
# with them, and rain that fell on a day the thermometer failed still fell.
temps = df.dropna(subset=["max_temp", "min_temp"])

print("Days with no temperature reported :", no_temp,
      "(left out of the temperature figures only)")
print("Days with the rain column blank   :", no_rain, "(taken as 0 mm)")
print("Days in the file                  :", len(df))
print("Days with a usable temperature    :", len(temps))
print()

# --- 3. Question 1: the shape of the year --------------------------------
monthly = temps.groupby("month")[["max_temp", "min_temp"]].mean().reindex(order).round(1)

print("--- Average temperature, month by month ---")
print(monthly)
print()
print("Hottest month  :", monthly["max_temp"].idxmax(),
      "at", monthly["max_temp"].max(), "C")
print("Coldest month  :", monthly["min_temp"].idxmin(),
      "at", monthly["min_temp"].min(), "C")
print("Highest reading:", temps["max_temp"].max(), "C on",
      temps.loc[temps["max_temp"].idxmax(), "date"].date())
print("Lowest reading :", temps["min_temp"].min(), "C on",
      temps.loc[temps["min_temp"].idxmin(), "date"].date())
print()

# Two lines on one pair of axes, so the gap between them can be seen. That
# gap is the day-night swing, and it closes in the monsoon.
plt.figure(figsize=(9, 4.5))
plt.plot(monthly.index, monthly["max_temp"], marker="o",
         color="#e05b3a", label="Average maximum")
plt.plot(monthly.index, monthly["min_temp"], marker="s",
         color="#3b7dd8", label="Average minimum")
plt.title("Average daily temperature through the year")
plt.xlabel("Month")
plt.ylabel("Temperature (C)")
plt.legend()
plt.grid(True, linestyle="--", alpha=0.5)
plt.tight_layout()
plt.savefig("chart1_temperature.png")
plt.close()

# --- 4. Question 2: when does the rain come? -----------------------------
rain_month = df.groupby("month")["rainfall_mm"].sum().reindex(order).round(1)
total_rain = rain_month.sum()

print("--- Rainfall, month by month (mm) ---")
print(rain_month)
print()
print("Rain for the year :", round(total_rain, 1), "mm")
monsoon = rain_month[["Jun", "Jul", "Aug", "Sep"]].sum()
print("June to September :", round(monsoon, 1), "mm, which is",
      round(monsoon / total_rain * 100, 1), "% of the year's rain")
print()

plt.figure(figsize=(9, 4.5))
plt.bar(rain_month.index, rain_month.values, color="#2f8fa8")
plt.title("Rainfall, month by month")
plt.xlabel("Month")
plt.ylabel("Rainfall (mm)")
plt.tight_layout()
plt.savefig("chart2_rainfall.png")
plt.close()

# --- 5. Question 3: spread out, or a few heavy days? ---------------------
rainy = df[df["rainfall_mm"] > 0]
print("--- Rainy days ---")
print("Days on which it rained  :", len(rainy), "out of", len(df))

# Everything below divides by the year's rain or asks for the biggest day, and
# neither means anything if it never rained. A whole year without a drop will
# not happen; a few days of readings with none in them happens all the time,
# and without this guard the program stops with ValueError rather than saying
# so.
if len(rainy) == 0:
    print("It did not rain once in this file, so there is nothing more to say.")
else:
    print("Wettest single day       :", rainy["rainfall_mm"].max(), "mm on",
          rainy.loc[rainy["rainfall_mm"].idxmax(), "date"].date())

    # The point of this line: a handful of days can carry most of the rain.
    heavy = rainy[rainy["rainfall_mm"] >= 25]
    print("Days of 25 mm or more    :", len(heavy), "-- they carried",
          round(heavy["rainfall_mm"].sum() / total_rain * 100, 1), "% of the year's rain")
print()

rainy_days = rainy.groupby("month")["rainfall_mm"].count().reindex(order).fillna(0).astype(int)
print("--- Number of rainy days each month ---")
print(rainy_days)
print()

plt.figure(figsize=(9, 4.5))
plt.bar(rainy_days.index, rainy_days.values, color="#4c9f70")
plt.title("Number of days it rained, month by month")
plt.xlabel("Month")
plt.ylabel("Rainy days")
plt.tight_layout()
plt.savefig("chart3_rainy_days.png")
plt.close()

# --- 6. Question 4: what is a normal day? --------------------------------
print("--- Daily maximum temperature ---")
print(temps["max_temp"].describe().round(1))
print()
above40 = temps[temps["max_temp"] >= 40]
print("Days at 40 C or above:", len(above40))
below10 = temps[temps["min_temp"] <= 10]
print("Nights at 10 C or below:", len(below10))
print()

plt.figure(figsize=(8, 4.5))
plt.hist(temps["max_temp"].values, bins=14, color="#c9772f", edgecolor="white")
plt.title("How often each daytime temperature occurs")
plt.xlabel("Daily maximum temperature (C)")
plt.ylabel("Number of days")
plt.tight_layout()
plt.savefig("chart4_temp_spread.png")
plt.close()

# --- 7. Question 5: humidity against rain --------------------------------
hum_month = df.groupby("month")["humidity"].mean().reindex(order).round(1)
print("--- Average humidity, month by month (%) ---")
print(hum_month)
print()
print("Correlation between humidity and rainfall:",
      round(df["humidity"].corr(df["rainfall_mm"]), 3))
if len(rainy) > 0:
    print("Average humidity on a rainy day :", round(rainy["humidity"].mean(), 1), "%")
print("Average humidity on a dry day   :",
      round(df[df["rainfall_mm"] == 0]["humidity"].mean(), 1), "%")
print()

plt.figure(figsize=(9, 4.5))
plt.plot(hum_month.index, hum_month.values, marker="o", color="#a05fc0")
plt.title("Average humidity through the year")
plt.xlabel("Month")
plt.ylabel("Relative humidity (%)")
plt.grid(True, linestyle="--", alpha=0.5)
plt.tight_layout()
plt.savefig("chart5_humidity.png")
plt.close()

# --- 8. The one-page summary --------------------------------------------
summary = pd.DataFrame({
    "avg_max_temp": monthly["max_temp"],
    "avg_min_temp": monthly["min_temp"],
    "rainfall_mm": rain_month,
    "rainy_days": rainy_days,
    "avg_humidity": hum_month,
})
summary.to_csv("month_summary.csv")

print("Charts saved : chart1_temperature.png .. chart5_humidity.png")
print("Summary saved: month_summary.csv")The full report as a PDF, ready to print and fill in. Or the working project as a zip — the program, the dataset, the charts and a README.
10Sample output
A real run, reproduced exactly as it appeared. Nothing below was typed by hand — it is the transcript of the program above against the dataset in section 4.
Rows read        : 365
From             : 2025-07-01 to 2026-06-30

Days with no temperature reported : 5 (left out of the temperature figures only)
Days with the rain column blank   : 3 (taken as 0 mm)
Days in the file                  : 365
Days with a usable temperature    : 360

--- Average temperature, month by month ---
       max_temp  min_temp
month
Jan        22.4       9.0
Feb        27.0      12.8
Mar        33.5      17.9
Apr        37.9      23.3
May        39.0      26.7
Jun        37.0      27.2
Jul        34.2      25.8
Aug        33.2      24.9
Sep        32.8      21.8
Oct        29.9      16.1
Nov        26.2      10.5
Dec        22.1       8.1

Hottest month  : May at 39.0 C
Coldest month  : Dec at 8.1 C
Highest reading: 43.0 C on 2026-04-03
Lowest reading : 4.4 C on 2026-01-01

--- Rainfall, month by month (mm) ---
month
Jan      9.1
Feb      4.0
Mar      0.0
Apr      5.5
May      6.1
Jun    130.2
Jul    345.8
Aug    229.5
Sep     27.4
Oct      0.7
Nov      0.0
Dec     17.5
Name: rainfall_mm, dtype: float64

Rain for the year : 775.8 mm
June to September : 732.9 mm, which is 94.5 % of the year's rain

--- Rainy days ---
Days on which it rained  : 64 out of 365
Wettest single day       : 63.0 mm on 2025-07-22
Days of 25 mm or more    : 10 -- they carried 50.4 % of the year's rain

--- Number of rainy days each month ---
month
Jan     2
Feb     2
Mar     0
Apr     1
May     3
Jun    14
Jul    16
Aug    16
Sep     7
Oct     1
Nov     0
Dec     2
Name: rainfall_mm, dtype: int64

--- Daily maximum temperature ---
count    360.0
mean      31.2
std        6.1
min       17.2
25%       26.9
50%       31.9
75%       35.8
max       43.0
Name: max_temp, dtype: float64

Days at 40 C or above: 20
Nights at 10 C or below: 62

--- Average humidity, month by month (%) ---
month
Jan    68.3
Feb    58.6
Mar    42.1
Apr    36.6
May    42.6
Jun    67.9
Jul    86.1
Aug    82.3
Sep    67.1
Oct    57.0
Nov    64.7
Dec    72.7
Name: humidity, dtype: float64

Correlation between humidity and rainfall: 0.395
Average humidity on a rainy day : 80.7 %
Average humidity on a dry day   : 58.3 %

Charts saved : chart1_temperature.png .. chart5_humidity.png
Summary saved: month_summary.csv
Running it also wrote month_summary.csv — 12 rows. This is the head of it:
month,avg_max_temp,avg_min_temp,rainfall_mm,rainy_days,avg_humidity
Jan,22.4,9.0,9.1,2,68.3
Feb,27.0,12.8,4.0,2,58.6
Mar,33.5,17.9,0.0,0,42.1
Apr,37.9,23.3,5.5,1,36.6
May,39.0,26.7,6.1,3,42.6
Jun,37.0,27.2,130.2,14,67.9
Jul,34.2,25.8,345.8,16,86.1
Aug,33.2,24.9,229.5,16,82.3
Sep,32.8,21.8,27.4,7,67.111The charts, and what each one says
CBSE asks for appropriate charts, and the word doing the work in that phrase is appropriate. A line for something that moves in order, a bar to compare things that do not, a histogram for the shape of one column of numbers. Each chart below says which it is, why that kind was chosen, and what it turned out to show.
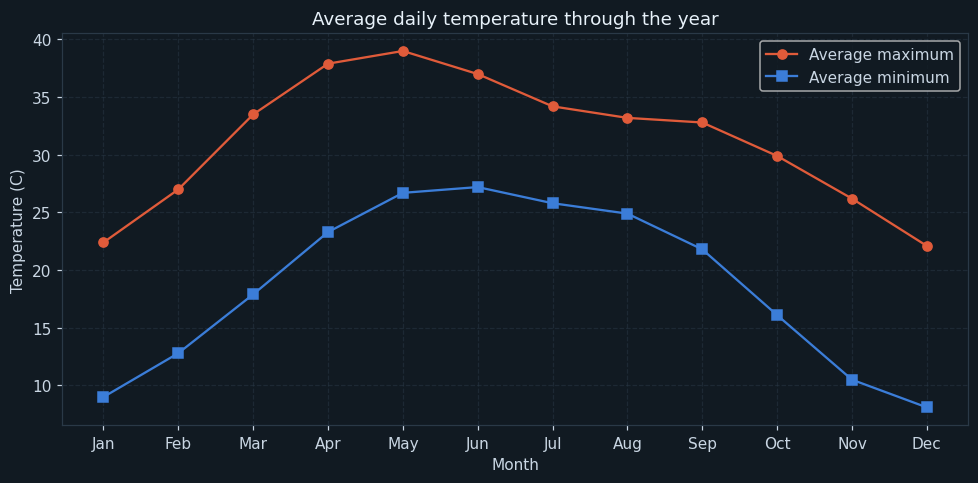
Two lines: the average daily maximum and the average nightly minimum, month by month. The gap between them is the day-night swing, and watching that gap open and close is the reason both lines are on one chart rather than two.
May is the hottest month at an average maximum of 39.0 degrees, and the coldest nights come in December at an average of 8.1. The single highest reading of the year was 43.0 on 3 April and the lowest 4.4 on New Year's Day.
The gap between the lines is the part worth pointing at. In April it is over 14 degrees; in July and August it narrows to about eight. That closing is the monsoon: cloud stops the ground losing its heat at night, so the nights stay warm even as the days cool. Two lines on one chart show that in a glance and no table would.
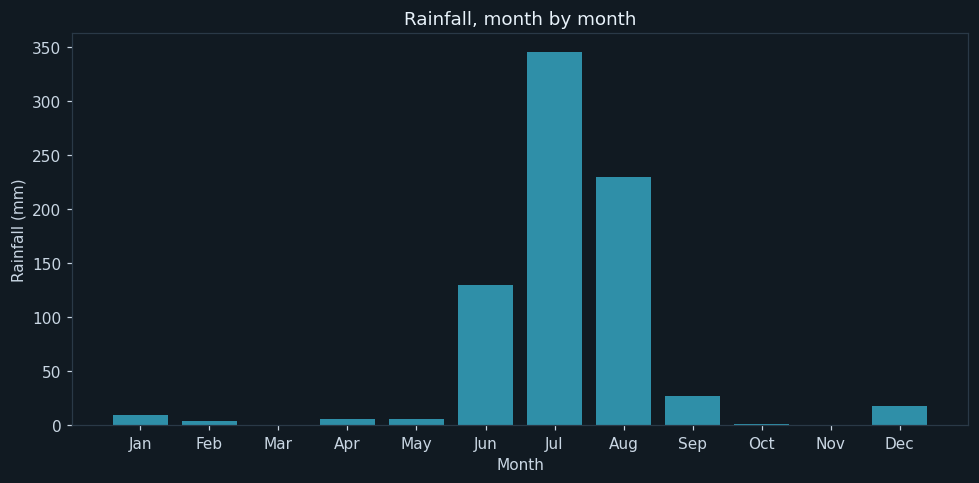
Total rainfall in each month. Bars rather than a line, because a month's rain is a quantity that accumulated, not a level that was measured — and the eye reads a bar as an amount.
The year brought 775.8 mm of rain, and 732.9 mm of it — 94.5 per cent — fell in June, July, August and September. July alone brought 345.8 mm.
March had none at all and October, November and December between them had 18.2 mm. Eight months of the year are, for practical purposes, dry. That is the argument for every water tank and every check dam in the district, and it is one bar chart.
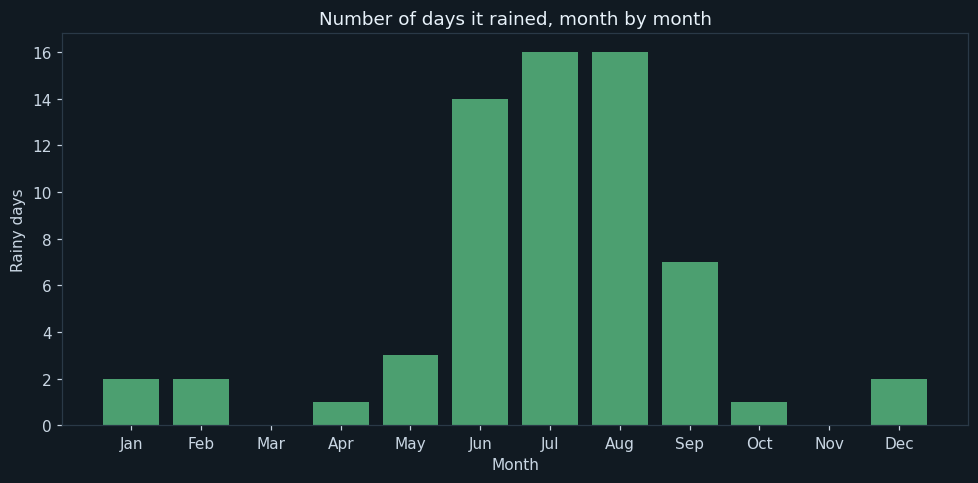
The number of days in each month on which any rain at all was recorded. The same months as the last chart, counted a different way — and the difference between the two charts is the finding.
It rained on 64 of the year's 365 days. June, July and August have 14, 16 and 16 rainy days; five months have two or fewer.
Set this beside the previous chart and something comes out. June had 14 rainy days for 130.2 mm; July had 16 for 345.8 mm. Almost the same number of rainy days, more than twice the rain — because July's days were heavier. The rain is not the number of days it fell on.
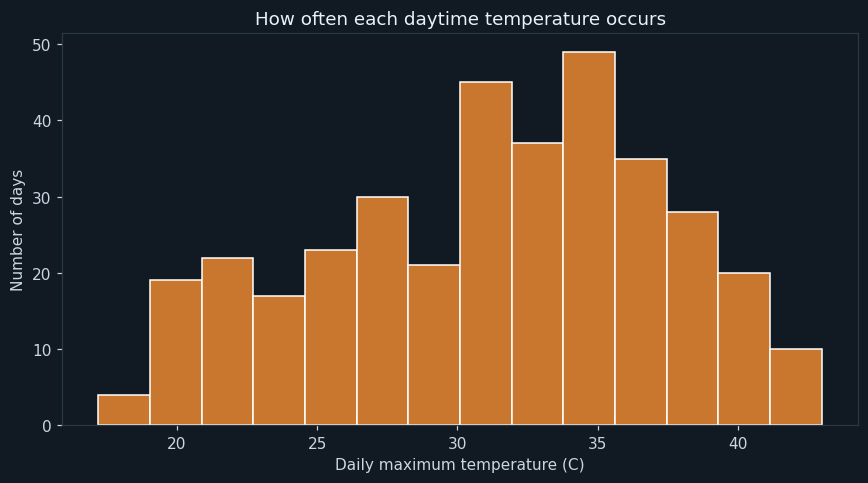
Every day's maximum temperature sorted into fourteen bands. A histogram, because the question is how the year's days are distributed rather than what happened on any one of them.
The median daily maximum is 31.9 degrees and the middle half of the year sits between 26.9 and 35.8. That is the ordinary day nobody remembers.
Only 20 days of the year reached 40 degrees or more — about one day in eighteen. Ask anybody in the city how many days were over 40 and the answer will be far higher, and this chart is why: the twenty stick, and the two hundred ordinary days do not. Sixty-two nights fell to 10 degrees or below.
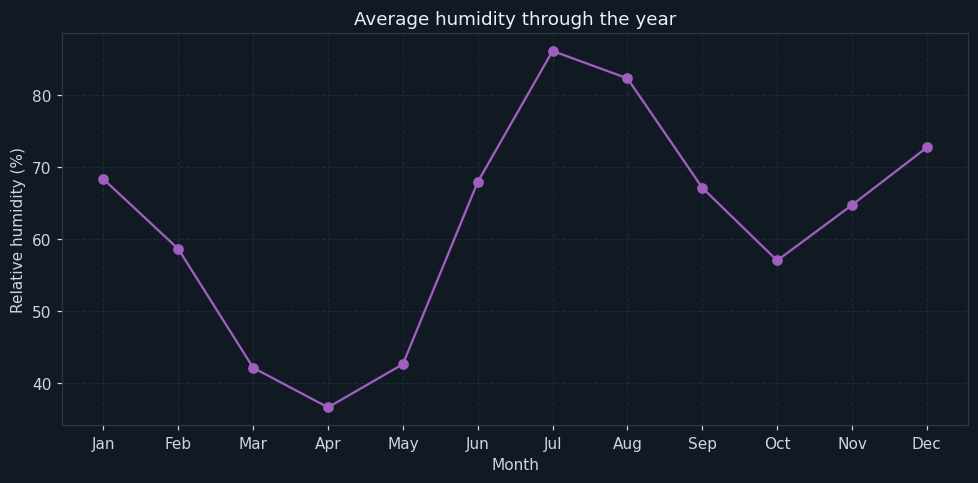
Average relative humidity month by month. A line, because humidity is a level that was measured rather than a quantity that piled up — the opposite of the rainfall chart, and worth noticing.
Humidity peaks at 86.1 per cent in July and bottoms at 36.7 in April. The complaint about the monsoon is not really about the rain: 34 degrees at 86 per cent humidity is far more unpleasant than 38 at 37.
The correlation between daily humidity and daily rainfall is 0.397 — positive, and much weaker than most people would guess. The day-by-day comparison says it better: humidity averages 80.7 per cent on days it rained and 58.3 on days it did not. Humid days and rainy days overlap heavily without being the same thing, and a correlation of 0.397 is exactly what that looks like as a number.
12What the analysis found
- The year brought 775.8 mm of rain, 94.5 per cent of it between June and September.
- Ten days of 25 mm or more carried 50.4 per cent of the entire year's rain.
- It rained on 64 days out of 365; three months had one rainy day or none.
- May is the hottest month at 39.0 degrees average maximum; the highest single reading was 43.0.
- Only 20 days reached 40 degrees or above, and 62 nights fell to 10 or below.
- The day-night gap runs over 14 degrees in April and closes to about 8 in the monsoon.
- Humidity averages 80.7 per cent on rainy days against 58.3 on dry ones, at a correlation of 0.397.
What should be done about them
This is the part that turns an analysis into a project. A chart that nobody acts on is a picture; a recommendation somebody can argue with is a result.
- Any water storage the town builds has to catch a few enormous days, not a steady monsoon. Ten days carried half the year's rain.
- Drains should be sized for the wettest day on record, not for the wettest month divided by thirty.
- The eight dry months are the planning problem, not the four wet ones.
- For a heat plan, count the 20 days over 40 rather than working from what people remember.
- Get the station to fill the rainfall column in every day, even with a zero. A blank that has to be interpreted is a blank that will one day be interpreted wrongly.
13Testing
Every case below was actually executed and its result recorded as it appeared — including the ones expected to fail. Each one builds a small dataset of its own and runs the whole program against it.
| Test case | Expected | Actual | Result |
|---|---|---|---|
| The full year, 365 days | Rain for the year : 775.8 mm | Rain for the year : 775.8 mm | Pass |
| Days the station did not report are kept out of the temperature figures | Days with no temperature reported : 5 (left out of the temperature figures only) | Days with no temperature reported : 5 (left out of the temperature figures only) | Pass |
| A blank rain column is read as no rain, not as missing | Days with the rain column blank : 3 (taken as 0 mm) | Days with the rain column blank : 3 (taken as 0 mm) | Pass |
| Which leaves 360 days with a usable temperature | Days with a usable temperature : 360 | Days with a usable temperature : 360 | Pass |
| ...while all 365 days still count towards the rain | Days in the file : 365 | Days in the file : 365 | Pass |
| A day with no thermometer still contributes its rain | Rain for the year : 12.0 mm | Rain for the year : 12.0 mm | Pass |
| ...but is not counted as a day of temperature | Days with a usable temperature : 1 | Days with a usable temperature : 1 | Pass |
| A blank rain column does not become a rainy day | Days on which it rained : 0 out of 1 | Days on which it rained : 0 out of 1 | Pass |
| A recorded 0.0 mm is a dry day, not a rainy one | Days on which it rained : 1 out of 2 | Days on which it rained : 1 out of 2 | Pass |
| Exactly 25 mm counts as a heavy day, 24.9 does not | Days of 25 mm or more : 1 -- they carried 50.1 % of the year's rain | Days of 25 mm or more : 1 -- they carried 50.1 % of the year's rain | Pass |
| A day of exactly 40.0 C is counted, 39.9 is not | Days at 40 C or above: 1 | Days at 40 C or above: 1 | Pass |
| A night of exactly 10.0 C is counted, 10.1 is not | Nights at 10 C or below: 1 | Nights at 10 C or below: 1 | Pass |
| The months come out in calendar order, not alphabetical | Jan 20.0 8.0 | Jan 20.0 8.0 | Pass |
| weather.csv missing altogether | FileNotFoundError: [Errno 2] No such file or directory: 'weather.csv' | FileNotFoundError: [Errno 2] No such file or directory: 'weather.csv' | Pass |
Two kinds of case are in there on purpose. The boundary cases test the edge of a rule, where a program is most often wrong by one. The failure cases check that it stops cleanly and says why, instead of quietly producing a wrong answer.
14Advantages
Set against the ways the job is done today:
- It replaces remembered weather, which is systematically wrong, with counted weather
- The two kinds of blank are handled differently and the choice is stated, so a reader can disagree with it
- Rainfall is measured both as an amount and as a number of days, which is what exposes the heavy-day finding
- The whole year is re-analysed with one command when next year's readings arrive
- Every figure is traceable to a row of the file, so nothing has to be taken on trust
15Limitations and future scope
What this version cannot tell you
A data project should be honest about the limits of its own data. Each of these is a reason for one of the additions below:
- One station and one year. A single year cannot say anything about climate, only about that year.
- The blank-rainfall convention comes from the observer, not from the file — at another station a blank might mean something else
- There is no wind, no pressure and no sunshine, so the picture is partial
- Rainfall is a daily total, so a cloudburst and a day of drizzle look identical
- Correlation is not cause: the humidity and rainfall figure says they move together, not that one produces the other
What to add next
This is also where you make the project yours. Take one or two of these, or something nobody here thought of:
- Read ten years and put this year's line against the ten-year average
- Compare with the IMD's published normals for the same station
- Count the length of the longest dry spell, which matters more to a farmer than the annual total
- Add the date the monsoon arrived each year and see whether it is moving
- Chart a heat-index rather than temperature alone, since humidity is what makes 34 degrees intolerable
- Fetch the readings straight from data.gov.in instead of a downloaded file
16What you may have to teach yourself
CBSE expects some self-learning in a project and says so. For this one, that means:
- How to find real weather data and check its licence. data.gov.in and the IMD are the two places to start, and reading the licence before you republish anything is part of the exercise.
- Why a missing value has to be understood before it can be handled — the two blanks in this file are the whole lesson
- What a correlation of 0.397 means, and why it is neither nothing nor proof
- The difference between a bar chart and a line chart, which this project uses to make a point: rainfall accumulates and gets bars, humidity is a level and gets a line
17Conclusion
The program does what it set out to do. A year of daily readings comes back as five charts and a summary table, and five questions that were previously answered from memory now have figures behind them.
The finding worth carrying away is the one about heavy days. Ten days of the year, out of 360, carried more than half of all the rain that fell. Nobody would guess that, and it changes what a town should build — a drain sized for an average monsoon day will be under water on the day it is needed.
The hardest part was not the analysis but a decision that took two lines of code. This file has two kinds of blank in it that look identical, and treating them the same way would have been wrong either way round: three real dry days would have disappeared from the rainy-day count, or five days with no thermometer reading would have been given a temperature nobody measured. Nothing in the file says which blank is which. Only the person who kept the register knows, which is why a data project starts with asking them.
One of those two decisions was wrong when it was first written, and a test is what found it. The original program dropped the whole row whenever the thermometer had failed, which quietly threw away five days of perfectly good rainfall along with it. On this year's readings none of those five days was wet, so the total did not move and nothing looked amiss — the fault was real and invisible. The program now keeps every day in the file and only holds the five out of the temperature figures.
18References
Every report needs a bibliography, and a data project needs its data source at the top of it.
- India Meteorological Department, station and district data — https://mausam.imd.gov.in/
- Open Government Data Platform India, rainfall and temperature datasets — https://data.gov.in/
- The dataset shipped with this project is a LambdaLab sample generated to resemble a north-Indian plains city. It is not a record of any real place and must not be cited as one.
- pandas user guide, “Working with missing data” — https://pandas.pydata.org/docs/user_guide/missing_data.html
- Informatics Practices, Class XII — the NCERT / CBSE prescribed textbook, for the chapters on data handling with pandas and data visualisation
- pandas documentation — https://pandas.pydata.org/docs/
- Matplotlib documentation — https://matplotlib.org/stable/
- CBSE Senior School Curriculum, Informatics Practices (Subject Code 065) — the project guidelines this report follows
- LambdaLab — https://www.lambdalab.in