What the Chemist Shop Is Losing
A year of sales and a shelf of stock, read out of MySQL — and thirty-four thousand rupees about to expire.
1Introduction: the problem it solves
A chemist shop is a business with a clock running on its stock. Every strip on the shelf has a date on it, and on that date the strip stops being medicine worth money and becomes waste that has to be disposed of properly. The shopkeeper knows this perfectly well and still loses stock to it, because checking three hundred packs by hand means reading three hundred small printed dates.
The dates are already in the shop's computer. So is a year of sales. Between them they answer the questions that decide whether the shop makes money: which medicines earn it, when the busy months are, which kinds of stock sit still, what is about to expire, and which supplier the shop's money is tied up with.
This project reads both tables out of MySQL, does the analysis in pandas, and prints an expiry alert list the shop can act on the same morning.
The owner of a chemist shop, and anybody who has to decide what to reorder, what to return to the supplier and what has already been lost.
Why it is worth doing on a computer
The expiry question alone justifies it. A pack that expires is a total loss — it cannot be sold, discounted or returned once the date passes, and it costs money to dispose of. This shop had already lost Rs 9,018 and had another Rs 34,203 inside ninety days. Neither figure was known before the program was run, and both were sitting in the database.
The second reason is subtler and worth more over a year. Stock that does not move is money the shop cannot use — it has been paid for, it is sitting on a shelf, and it will go on sitting there. Nobody notices slow stock, because a shelf that has not emptied looks exactly like a shelf that is well supplied. Comparing what was sold against what is held is the only way to tell those apart, and it is two lines of pandas.
Objectives
- To read the shop's medicines and a year of its sales out of a MySQL database into pandas
- To rank medicines by what they earned, and measure how much of the year's takings the top ten carry
- To show how sales move month by month, so buying can be planned for the busy season
- To compare each kind of medicine's sales against the stock held in it, and so find the stock that does not move
- To list everything already expired and everything expiring within ninety days, with the money attached to each
- To show where the shop's stock money is tied up, supplier by supplier
- To write an expiry alert list out as a CSV the shop can print and work from
2How the job is done today
Before writing anything it is worth asking how the work is handled at present, and where each of those answers falls short. These were examined:
What the shop actually does, once or twice a year. It works, it takes a whole day, and by the time it is done something else has come within ninety days of expiry.
Most distributors give the shop a billing package. It records sales well and is built around the distributor's catalogue, not the shop's shelf, and its reports rarely include an expiry horizon.
Common, and better than nothing. It goes out of date the moment a sale is made, because nothing links it to what was sold — which is exactly the link the database provides.
Does all of this and much more, and is priced for a chain rather than a single shop. It also puts the shop's data somewhere it cannot easily query for itself.
3Where the data came from
CBSE asks that any resource used in a project be suitably referenced, and for a data project that rule is not a formality — a figure with no source attached to it does not mean anything. This section is the one an examiner will ask about.
The shop keeps its stock and its sales in two tables. `medicines` has one row per product — the name, its kind, its supplier, the printed price, how many units are on the shelf and the expiry date on the pack. `sales` has one row per item sold, pointing at a medicine by its id.
That split is the whole design. A medicine's name and price are stored once, in one place, so renaming a product renames it everywhere; and a sale records which medicine, not what it was called at the time. Three thousand six hundred sales rows carry no product names at all.
The database shipped here is a LambdaLab sample: 30 medicines and 3,608 sales over a year, in a schema.sql you can load into MySQL in one command. Nothing in it is a real shop's trade. For your own project, ask a chemist near you, use their figures with permission, and say in the report whose data it is — and do not put a customer or a prescription in the file, because that is somebody's medical history.
4The dataset
Two tables, and the relationship is the point. `sales` stores a med_id and nothing else about the product; the name, kind, supplier and price live once in `medicines`. The SQL in this project is deliberately plain — it pulls the rows out with one JOIN and pandas does all the arithmetic, which is easier to read and is what the Informatics Practices course is about.
medicines — one row per product on the shelf
| Field | Type | What it holds |
|---|---|---|
med_id | INT PRIMARY KEY | The product's id. What `sales` points at. |
name | VARCHAR(60) | The medicine's name and strength, e.g. Paracetamol 500mg. |
type | VARCHAR(20) | Tablet, Capsule, Syrup, Injection, Ointment, Drops, Powder, Inhaler or Other. |
supplier | VARCHAR(40) | Which distributor it comes from. |
mrp | DECIMAL(8,2) | The price printed on the pack. |
stock | INT | Units on the shelf on the day of the count. |
expiry_date | DATE | The date printed on the pack. |
sales — one row per item sold
| Field | Type | What it holds |
|---|---|---|
sale_id | INT PRIMARY KEY | The sale's own id. |
med_id | INT, FOREIGN KEY | Which medicine was sold. Must exist in `medicines`. |
sale_date | DATE | The day of the sale. |
qty | INT | How many units. |
The tables, as the schema creates them
Creates both tables and loads the sample rows — 30 medicines and 3,608 sales. Load it with one command before running the program. The whole file is 3,638 rows, 103.5 KB — too much to print here, so this is the structure it creates. The complete file comes with the download, and you can also take it on its own.
-- ---------------------------------------------------------------------
-- schema.sql  --  the chemist shop's database
--
-- Two tables. `medicines` holds one row per product the shop keeps, and
-- `sales` holds one row per item sold. A sale points at a medicine by its
-- id, so a product renamed in `medicines` is renamed everywhere at once.
--
-- Load it with:   mysql -u root -p < schema.sql
-- ---------------------------------------------------------------------

CREATE DATABASE IF NOT EXISTS lambdalab_chemist;
USE lambdalab_chemist;

DROP TABLE IF EXISTS sales;
DROP TABLE IF EXISTS medicines;

CREATE TABLE medicines (
    med_id      INT PRIMARY KEY,
    name        VARCHAR(60)  NOT NULL,
    type        VARCHAR(20)  NOT NULL,   -- Tablet, Syrup, Injection, ...
    supplier    VARCHAR(40)  NOT NULL,
    mrp         DECIMAL(8,2) NOT NULL,   -- price printed on the pack
    stock       INT          NOT NULL,   -- units on the shelf today
    expiry_date DATE         NOT NULL
);

CREATE TABLE sales (
    sale_id   INT PRIMARY KEY,
    med_id    INT  NOT NULL,
    sale_date DATE NOT NULL,
    qty       INT  NOT NULL,
    FOREIGN KEY (med_id) REFERENCES medicines(med_id)
);
The rows themselves follow in the same file, as ordinary INSERT statements. These are the first few:
INSERT INTO medicines VALUES
(1, 'Paracetamol 500mg', 'Tablet', 'Aggarwal Distributors', 22.00, 46, '2027-08-17'),
(2, 'Azithromycin 500mg', 'Tablet', 'Aggarwal Distributors', 118.00, 84, '2027-09-10'),
(3, 'Amoxicillin 500mg', 'Capsule', 'Aggarwal Distributors', 96.00, 94, '2028-11-14'),
(4, 'Cetirizine 10mg', 'Tablet', 'Sharma Medico', 18.00, 128, '2026-08-02'),
(5, 'Pantoprazole 40mg', 'Tablet', 'Sharma Medico', 84.00, 144, '2028-05-26'),5Cleaning the data
Real data arrives with mistakes in it, and this dataset has the ones real data actually has. What was wrong, how much of it there was, and what the program does about each — because how a problem is handled changes the answer, and a report has to say which choice it made.
pd.to_datetime() on sale_date and expiry_date. MySQL returns date objects and SQLite returns text; to_datetime copes with either, so the program does not depend on which database is behind it.
Subtracting two dates gives a Timedelta, which cannot be put in a histogram or compared with 90. .dt.days turns it into a plain count of days.
Stock value is stock x mrp and sales value is qty x mrp. They are different columns on different tables and the report is careful never to add one to the other.
The two groupings are joined and the gaps filled with 0, so a kind that never sold shows a turn of zero rather than disappearing from the table — which is exactly the row that most needed looking at.
6What the program does
- Connects to MySQL from Python and reads both tables straight into DataFrames
- Joins sales to medicines in SQL, so every sale arrives with its name, kind, supplier and price
- Ranks medicines by what they earned and measures the top ten's share of the year
- Charts sales month by month and names the busiest and quietest months
- Sets sales against stock held for each kind of medicine, and works out how many times each turned over
- Lists everything already expired, with the money lost
- Lists everything expiring within ninety days, with the money at risk, soonest first
- Shows where the shop's stock money is tied up, supplier by supplier
- Writes the expiry alert list out as a CSV the shop can print
The pandas and pyplot it is built from
| Call | Where | What it is for |
|---|---|---|
mysql.connector.connect() | step 1 | Opens the database from Python |
pd.read_sql(query, con) | step 2 | Sends SQL to MySQL and gets a DataFrame back |
JOIN ... ON s.med_id = m.med_id | step 2 | Brings each sale's medicine details alongside it |
con.close() | step 2 | Closes the connection as soon as the data is in pandas |
pd.to_datetime(series) | step 3 | Copes with both MySQL's date objects and SQLite's text |
(a - b).dt.days | step 3 | Turns a difference between two dates into a number of days |
df.groupby(col)[v].sum() | step 5 | The rankings by medicine, month, kind and supplier |
Series.dt.to_period("M") | step 5 | Drops the day part so a whole month groups together |
pd.DataFrame({a: x, b: y}) | step 5 | Sets sales and stock side by side in one table |
DataFrame.fillna(0) | step 5 | A kind with stock and no sales stays in the table as a zero |
df[(a >= 0) & (a <= 90)] | step 6 | Two conditions at once — note the brackets, which are required |
DataFrame.to_string(index=False) | step 6 | Prints the alert list without pandas' row numbers |
plt.axvline() | chart 4 | The dashed line marking the ninety-day warning |
plt.barh() | chart 1 | Sideways bars, because medicine names do not fit under vertical ones |
DataFrame.to_csv(index=False) | step 8 | Writes the alert list out for the shop to print |
7Technical details
| Language | Python 3 |
| Where the data lives | MySQL, read into pandas through mysql-connector-python |
| Libraries |
|
8How it works, step by step
mysql.connector.connect() opens the database. The user and password are in one place at the top, ready to be changed.
Two read_sql calls. The second carries a JOIN so every sale row arrives with its medicine's name, kind, supplier and price already attached.
to_datetime on both date columns, and .dt.days to turn the gap to expiry into a plain number.
Three new columns: what each sale was worth, what each product's stock is worth, and how many days each has left.
groupby() gives the ranking by medicine, the monthly totals, the sales and stock by kind, and the totals by supplier.
Boolean conditions split the shelf into what has already expired and what expires within ninety days.
Five charts — a horizontal bar, a line, two bars and a histogram — each saved with savefig().
9Source code
The whole program. Every chart further down this page was drawn by this listing, and every figure quoted came out of running it.
# ---------------------------------------------------------------------------
# stock_analysis.py
#
# The chemist keeps a year of sales and a shelf full of stock in MySQL. This
# program reads both into pandas and answers what the shop actually loses
# money on:
#
#   1. Which medicines earn the shop its money?
#   2. When in the year is the shop busy?
#   3. Which kinds of medicine sell, and which only take up shelf space?
#   4. What is going to expire soon, and what is that worth?
#   5. Which supplier is the shop's money tied up with?
#
# The SQL here is deliberately plain: it pulls the rows out, and pandas does
# the arithmetic. That is easier to read, easier to change, and it is what the
# Informatics Practices course is about.
# ---------------------------------------------------------------------------

import mysql.connector
import pandas as pd
import matplotlib.pyplot as plt

TODAY = pd.Timestamp("2026-06-30")      # the day the stock was counted

# --- 1. Connect ----------------------------------------------------------
# Change the user and password to the ones on your own computer.
con = mysql.connector.connect(
    host="localhost",
    user="root",
    password="your_password_here",
    database="lambdalab_chemist",
)

# --- 2. Read both tables into DataFrames ---------------------------------
# read_sql sends the query to MySQL and hands back a DataFrame, so from here
# on it is ordinary pandas — the same as if the data had come from a CSV.
meds = pd.read_sql("SELECT * FROM medicines", con)
sales = pd.read_sql(
    "SELECT s.sale_id, s.sale_date, s.qty, m.name, m.type, m.supplier, m.mrp "
    "FROM sales s JOIN medicines m ON s.med_id = m.med_id",
    con)
con.close()

print("Medicines on the shelf :", len(meds))
print("Sales in the year      :", len(sales))
print()

# MySQL gives dates back as date objects and SQLite as text. to_datetime()
# copes with either, so the program does not depend on which one is behind it.
sales["sale_date"] = pd.to_datetime(sales["sale_date"])
meds["expiry_date"] = pd.to_datetime(meds["expiry_date"])

# --- 3. Derive -----------------------------------------------------------
sales["value"] = sales["qty"] * sales["mrp"]       # what each sale was worth
meds["stock_value"] = meds["stock"] * meds["mrp"]  # money sitting on the shelf
# .dt.days turns the date difference into a plain number of days.
meds["days_to_expiry"] = (meds["expiry_date"] - TODAY).dt.days

print("Sales for the year   : Rs", round(sales["value"].sum(), 2))
print("Stock on the shelf   : Rs", round(meds["stock_value"].sum(), 2))
print("Units sold           :", int(sales["qty"].sum()))
print()

# --- 4. Question 1: which medicines earn the money? ----------------------
by_med = sales.groupby("name")["value"].sum().sort_values(ascending=False)

print("--- Ten highest-earning medicines ---")
print(by_med.head(10).round(2))
print()
print("The top ten are", round(by_med.head(10).sum() / by_med.sum() * 100, 1),
      "% of the year's takings.")
print()

top10 = by_med.head(10)[::-1]
plt.figure(figsize=(8, 5))
plt.barh(top10.index, top10.values, color="#3b7dd8")
plt.title("Ten highest-earning medicines")
plt.xlabel("Sales for the year (Rs)")
plt.tight_layout()
plt.savefig("chart1_top_medicines.png")
plt.close()

# --- 5. Question 2: when is the shop busy? -------------------------------
# to_period("M") drops the day part, so every date in a month becomes the
# same value and groupby can add the month up.
sales["month"] = sales["sale_date"].dt.to_period("M").astype(str)
monthly = sales.groupby("month")["value"].sum()

print("--- Sales, month by month ---")
print(monthly.round(2))
print()
print("Busiest month :", monthly.idxmax(), "at Rs", round(monthly.max(), 2))
print("Quietest month:", monthly.idxmin(), "at Rs", round(monthly.min(), 2))
print()

plt.figure(figsize=(9, 4.5))
plt.plot(monthly.index, monthly.values, marker="o", color="#e07b39")
plt.title("Sales of the chemist shop, month by month")
plt.xlabel("Month")
plt.ylabel("Sales (Rs)")
plt.xticks(rotation=45)
plt.grid(True, linestyle="--", alpha=0.5)
plt.tight_layout()
plt.savefig("chart2_monthly_sales.png")
plt.close()

# --- 6. Question 3: which kinds sell? ------------------------------------
by_type = sales.groupby("type")["value"].sum().sort_values(ascending=False)
stock_type = meds.groupby("type")["stock_value"].sum()

print("--- Sales by kind of medicine ---")
print(by_type.round(2))
print()
# Sales against stock held is the comparison that matters. A kind with a lot
# of stock and few sales is money the shop cannot use.
compare = pd.DataFrame({"sold": by_type, "on_shelf": stock_type}).fillna(0).round(2)
compare["turns"] = (compare["sold"] / compare["on_shelf"]).round(2)
print("--- Sold against stock held ---")
print(compare.sort_values("turns", ascending=False))
print()

plt.figure(figsize=(8.5, 4.5))
plt.bar(by_type.index, by_type.values, color="#4c9f70")
plt.title("Sales by kind of medicine")
plt.xlabel("Kind")
plt.ylabel("Sales for the year (Rs)")
plt.xticks(rotation=25)
plt.tight_layout()
plt.savefig("chart3_by_type.png")
plt.close()

# --- 7. Question 4: what is about to expire? -----------------------------
expired = meds[meds["days_to_expiry"] < 0]
soon = meds[(meds["days_to_expiry"] >= 0) & (meds["days_to_expiry"] <= 90)]

print("--- Already expired ---")
print(expired[["name", "expiry_date", "stock", "stock_value"]].to_string(index=False))
print("Value already lost: Rs", round(expired["stock_value"].sum(), 2))
print()
print("--- Expiring within 90 days ---")
print(soon[["name", "expiry_date", "days_to_expiry", "stock", "stock_value"]]
      .sort_values("days_to_expiry").to_string(index=False))
print("Value at risk: Rs", round(soon["stock_value"].sum(), 2))
print()

plt.figure(figsize=(8, 4.5))
plt.hist(meds["days_to_expiry"].values, bins=12, color="#c0653a", edgecolor="white")
plt.axvline(90, color="#c0392b", linestyle="--", label="90-day warning line")
plt.title("How long the stock has left before it expires")
plt.xlabel("Days to expiry (negative means already expired)")
plt.ylabel("Number of products")
plt.legend()
plt.tight_layout()
plt.savefig("chart4_expiry.png")
plt.close()

# --- 8. Question 5: where is the money tied up? --------------------------
by_supplier = meds.groupby("supplier")["stock_value"].sum().sort_values(ascending=False)
sold_supplier = sales.groupby("supplier")["value"].sum()

print("--- Stock value held, by supplier ---")
print(by_supplier.round(2))
print()
print("--- Sold in the year, by supplier ---")
print(sold_supplier.round(2))
print()

plt.figure(figsize=(8.5, 4.5))
plt.bar(by_supplier.index, by_supplier.values, color="#a05fc0")
plt.title("Money tied up in stock, by supplier")
plt.xlabel("Supplier")
plt.ylabel("Stock value (Rs)")
plt.xticks(rotation=12)
plt.tight_layout()
plt.savefig("chart5_suppliers.png")
plt.close()

# --- 9. The reorder and expiry list the shop prints ----------------------
alerts = meds[meds["days_to_expiry"] <= 90][
    ["name", "type", "expiry_date", "days_to_expiry", "stock", "stock_value"]]
alerts.sort_values("days_to_expiry").to_csv("expiry_alerts.csv", index=False)

print("Charts saved : chart1_top_medicines.png .. chart5_suppliers.png")
print("Alert list : expiry_alerts.csv")The full report as a PDF, ready to print and fill in. Or the working project as a zip — the program, the dataset, the charts and a README.
10Sample output
A real run, reproduced exactly as it appeared. Nothing below was typed by hand — it is the transcript of the program above against the dataset in section 4.
Medicines on the shelf : 30
Sales in the year      : 3608

Sales for the year   : Rs 757142.0
Stock on the shelf   : Rs 399678.0
Units sold           : 11150

--- Ten highest-earning medicines ---
name
Pantoprazole 40mg      54684.0
Insulin 100IU vial     41280.0
Cough syrup 100ml      40480.0
Salbutamol inhaler     40425.0
Diclofenac gel 30g     39825.0
Azithromycin 500mg     39648.0
Amoxicillin 500mg      39456.0
Atorvastatin 10mg      35100.0
Cefixime 200mg         34452.0
Antacid syrup 170ml    32512.0
Name: value, dtype: float64

The top ten are 52.5 % of the year's takings.

--- Sales, month by month ---
month
2025-07    78888.0
2025-08    84848.0
2025-09    55860.0
2025-10    52538.0
2025-11    51059.0
2025-12    75005.0
2026-01    77567.0
2026-02    64476.0
2026-03    60654.0
2026-04    47025.0
2026-05    55520.0
2026-06    53702.0
Name: value, dtype: float64

Busiest month : 2025-08 at Rs 84848.0
Quietest month: 2026-04 at Rs 47025.0

--- Sales by kind of medicine ---
type
Tablet       338138.0
Syrup         99557.0
Ointment      66735.0
Injection     57955.0
Capsule       57222.0
Powder        42615.0
Inhaler       40425.0
Other         29109.0
Drops         25386.0
Name: value, dtype: float64

--- Sold against stock held ---
               sold  on_shelf  turns
type
Tablet     338138.0   66166.0   5.11
Capsule     57222.0   15282.0   3.74
Powder      42615.0   22559.0   1.89
Injection   57955.0   34270.0   1.69
Syrup       99557.0   74782.0   1.33
Ointment    66735.0   51020.0   1.31
Drops       25386.0   21272.0   1.19
Inhaler     40425.0   47775.0   0.85
Other       29109.0   66552.0   0.44

--- Already expired ---
          name expiry_date  stock  stock_value
Amlodipine 5mg  2026-06-16     23        828.0
Eye drops 10ml  2026-06-09    105       8190.0
Value already lost: Rs 9018.0

--- Expiring within 90 days ---
              name expiry_date  days_to_expiry  stock  stock_value
        ORS sachet  2026-07-21              21    192       4224.0
   Cetirizine 10mg  2026-08-02              33    128       2304.0
Diclofenac gel 30g  2026-09-09              71    205      27675.0
Value at risk: Rs 34203.0

--- Stock value held, by supplier ---
supplier
Nova Pharma Agency       158910.0
Aggarwal Distributors    131861.0
Sharma Medico            108907.0
Name: stock_value, dtype: float64

--- Sold in the year, by supplier ---
supplier
Aggarwal Distributors    229157.0
Nova Pharma Agency       286460.0
Sharma Medico            241525.0
Name: value, dtype: float64

Charts saved : chart1_top_medicines.png .. chart5_suppliers.png
Alert list : expiry_alerts.csvschema.sql into MySQL and change the user and password in the connect() call to your own.Running it also wrote expiry_alerts.csv — 5 rows. This is the head of it:
name,type,expiry_date,days_to_expiry,stock,stock_value
Eye drops 10ml,Drops,2026-06-09,-21,105,8190.0
Amlodipine 5mg,Tablet,2026-06-16,-14,23,828.0
ORS sachet,Powder,2026-07-21,21,192,4224.0
Cetirizine 10mg,Tablet,2026-08-02,33,128,2304.0
Diclofenac gel 30g,Ointment,2026-09-09,71,205,27675.011The charts, and what each one says
CBSE asks for appropriate charts, and the word doing the work in that phrase is appropriate. A line for something that moves in order, a bar to compare things that do not, a histogram for the shape of one column of numbers. Each chart below says which it is, why that kind was chosen, and what it turned out to show.
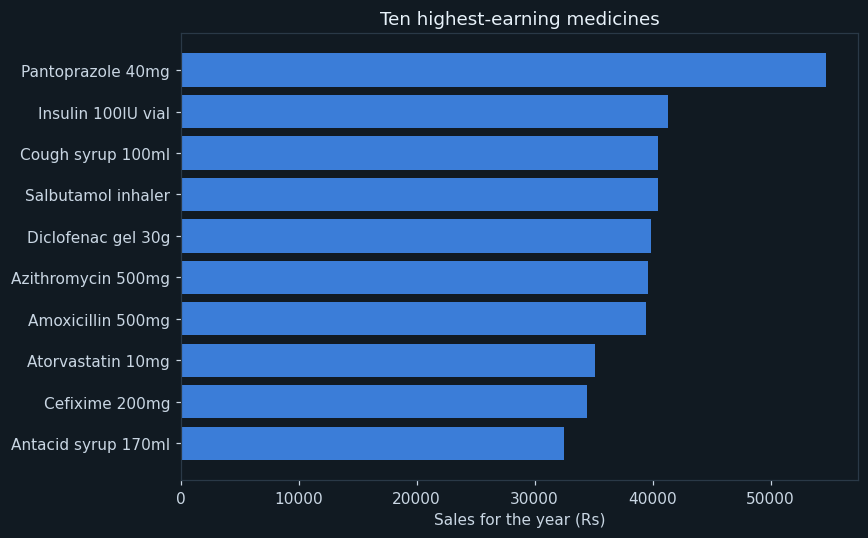
The ten highest-earning medicines by their year's sales, biggest at the top. Horizontal bars, because medicine names are long and would be unreadable turned sideways under a vertical bar.
Pantoprazole 40mg leads at Rs 54,684, and the ten together carry 52.5 per cent of the year's Rs 757,142.
The names in that list are worth reading as a group. Pantoprazole, insulin, an inhaler, a statin — these are the medicines somebody takes every day for years, not the ones bought once for a fever. Half the shop's income comes from long-term patients, which says more about how to run it than any single figure here: those customers come back on a schedule, and running out is the one thing that loses them.
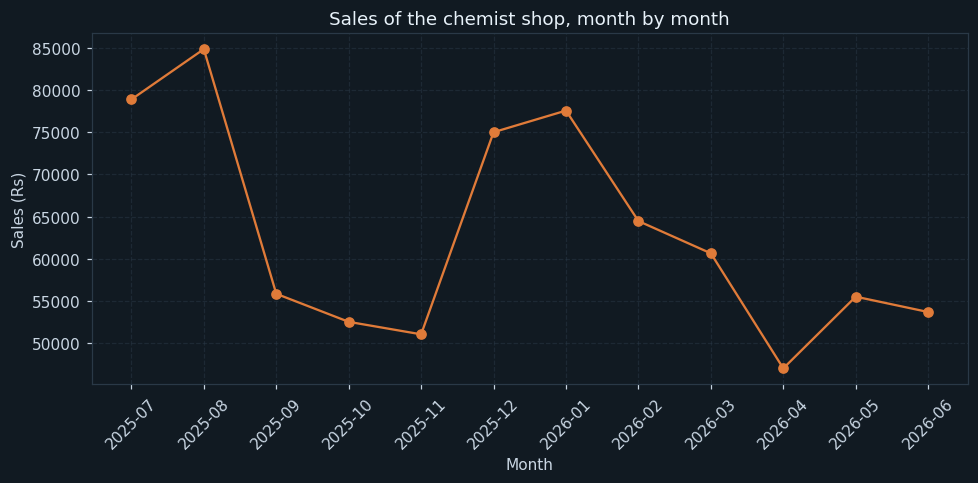
Total sales in each of the twelve months. A line, because the months are in order and the shape is the point.
August is the busiest month at Rs 84,848 and April the quietest at Rs 47,025 — the busy month is 1.8 times the quiet one.
The two humps are the monsoon and the winter: July and August, then December and January. Both are seasons of coughs, colds and fevers, and both are entirely predictable. A shop that buys the same quantity every month is short in August and overstocked in April, and this chart is the buying calendar it did not have.
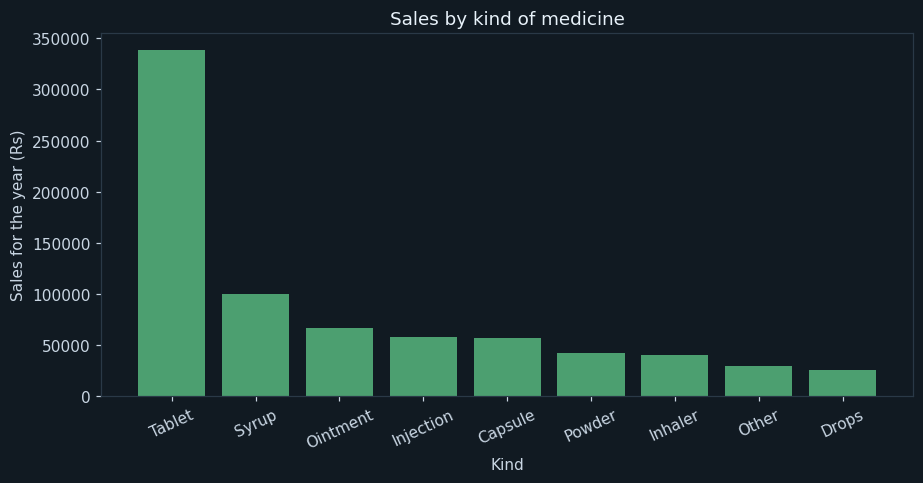
Sales for the year by kind of medicine — tablet, syrup, injection and so on. Bars, because the kinds have no natural order and the comparison is between heights.
Tablets take Rs 338,138, which is 45 per cent of everything the shop sells, and more than the next three kinds put together.
The chart on its own is not the finding. The finding is in the table printed beside it, which divides each kind's sales by the stock held in it. Tablets turned over 5.11 times in the year. "Other" — cotton, bandages, a thermometer — turned over 0.44 times, and inhalers 0.85. The shop has Rs 66,552 of "Other" on its shelves and sold Rs 29,109 of it all year. That is money bought once and still sitting there, and no sales chart alone would have shown it.
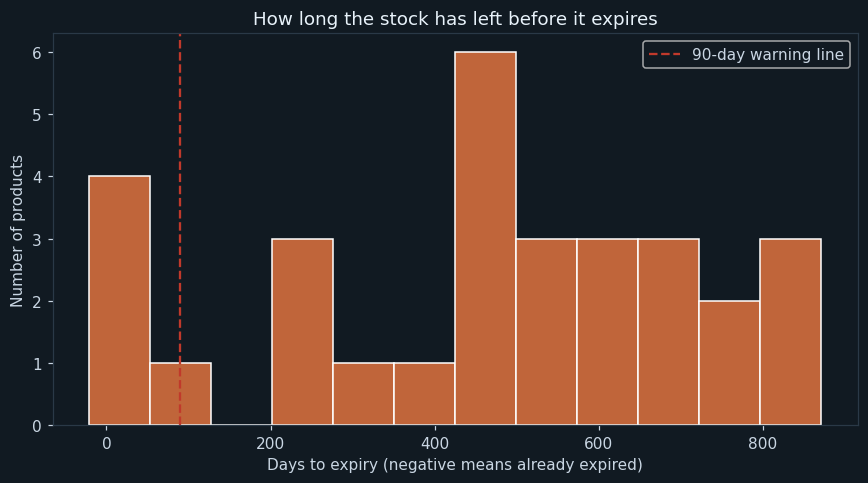
Every product sorted by how many days remain before the date on its pack, with a dashed line at ninety days. Anything left of that line needs a decision; anything left of zero is already waste.
Two products are already past their date: 105 units of eye drops worth Rs 8,190 and 23 of amlodipine worth Rs 828. Rs 9,018 has already been lost and nobody had noticed.
Three more are inside ninety days, worth Rs 34,203 between them — and Rs 27,675 of that is a single product, diclofenac gel, with 205 units and 71 days left. That one line is the whole value of the project: 71 days is enough time to discount it, move it to the front of the counter or arrange a return, and in a fortnight it will not be.
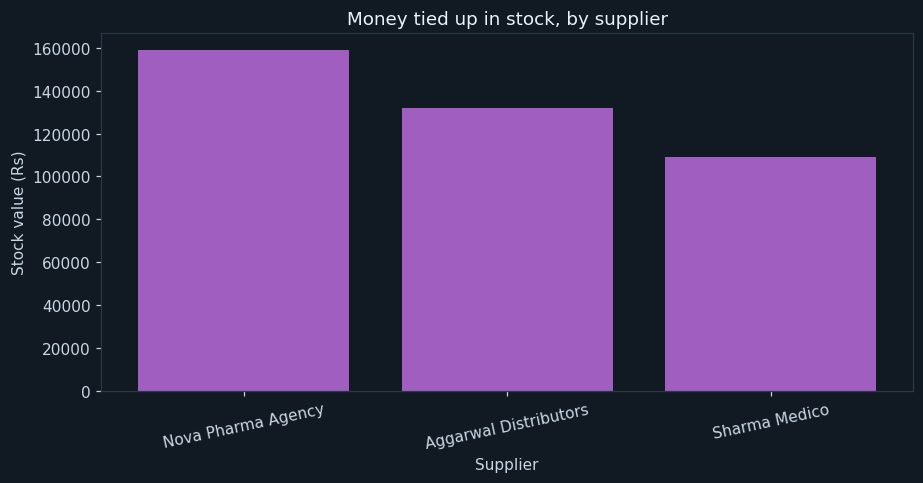
The value of the stock held from each of the three distributors. This is money already paid out and not yet earned back, which is a different question from who sells the most.
Nova Pharma Agency holds the most of the shop's money at Rs 158,910, then Aggarwal at Rs 131,861 and Sharma at Rs 108,907.
Set that against what each sold in the year and the order shifts. Nova sold Rs 286,460 against Rs 158,910 held; Aggarwal sold Rs 229,157 against Rs 131,861. Both turn about 1.8 times. Sharma sold Rs 241,525 on only Rs 108,907 of stock — over twice — so Sharma's products are earning more per rupee tied up in them than either of the others.
12What the analysis found
- The shop sold Rs 757,142 in the year and holds Rs 399,678 of stock.
- The ten highest-earning medicines carry 52.5 per cent of the takings, and most are long-term prescriptions.
- August is the busiest month at Rs 84,848 and April the quietest at Rs 47,025.
- Tablets turn over 5.11 times a year; "Other" turns over 0.44 and inhalers 0.85.
- Rs 9,018 of stock has already expired without anybody noticing.
- Rs 34,203 more expires within ninety days, Rs 27,675 of it in one product.
- Sharma Medico's stock earns more than twice its value in a year; the other two suppliers earn about 1.8 times.
What should be done about them
This is the part that turns an analysis into a project. A chart that nobody acts on is a picture; a recommendation somebody can argue with is a result.
- Deal with the diclofenac gel this week. Rs 27,675 with 71 days left is the single most valuable action in this report.
- Dispose of the expired eye drops and amlodipine properly and record the Rs 9,018 as a loss, so it is a number the shop can watch next year.
- Run the expiry alert every month. This whole loss happened because the check was annual.
- Stop reordering "Other" until the Rs 66,552 already on the shelf has moved.
- Buy for August in July and for January in December, and buy less in March.
- Never run out of the top ten. Those are repeat customers on a schedule, and a customer who finds the shelf empty once buys elsewhere from then on.
13Testing
Every case below was actually executed and its result recorded as it appeared — including the ones expected to fail. Each one builds a small dataset of its own and runs the whole program against it.
| Test case | Expected | Actual | Result |
|---|---|---|---|
| The full database, 30 medicines and 3608 sales | Sales for the year : Rs 757142.0 | Sales for the year : Rs 757142.0 | Pass |
| Stock on the shelf, from a second table | Stock on the shelf : Rs 399678.0 | Stock on the shelf : Rs 399678.0 | Pass |
| Money already lost to expiry | Value already lost: Rs 9018.0 | Value already lost: Rs 9018.0 | Pass |
| Money at risk inside ninety days | Value at risk: Rs 34203.0 | Value at risk: Rs 34203.0 | Pass |
| A pack dated the day of the count has not expired | Value already lost: Rs 10.0 | Value already lost: Rs 10.0 | Pass |
| ...and it counts as at risk, along with day 90 but not day 91 | Value at risk: Rs 20.0 | Value at risk: Rs 20.0 | Pass |
| Nothing expiring means nothing at risk, not a crash | Value at risk: Rs 0.0 | Value at risk: Rs 0.0 | Pass |
| Stock held is counted at MRP, separately from sales | Stock on the shelf : Rs 1000.0 | Stock on the shelf : Rs 1000.0 | Pass |
| ...and the sales are only what actually sold | Sales for the year : Rs 30.0 | Sales for the year : Rs 30.0 | Pass |
| ...which makes the turn 0.03, not 1 | Other 30.0 1000.0 0.03 | Other 30.0 1000.0 0.03 | Pass |
| A sale of ten units is worth ten times the price | Units sold : 10 | Units sold : 10 | Pass |
| A medicine nobody bought still counts as stock | Stock on the shelf : Rs 850.0 | Stock on the shelf : Rs 850.0 | Pass |
| ...and its kind shows a turn of zero rather than vanishing | Inhaler 0.0 800.0 0.0 | Inhaler 0.0 800.0 0.0 | Pass |
Two kinds of case are in there on purpose. The boundary cases test the edge of a rule, where a program is most often wrong by one. The failure cases check that it stops cleanly and says why, instead of quietly producing a wrong answer.
14Advantages
Set against the ways the job is done today:
- An expiry check that took a day now takes a second, so it can be run every month instead of every year
- Money already lost is measured rather than absorbed silently
- Stock that does not move is visible, which a sales report alone cannot show
- The database keeps each fact once, so a renamed product cannot disagree with itself
- Buying can be planned against a real seasonal pattern instead of last month's guess
- Adding another year of sales changes nothing in the program
15Limitations and future scope
What this version cannot tell you
A data project should be honest about the limits of its own data. Each of these is a reason for one of the additions below:
- It works from MRP, not from what the shop paid, so these are takings and not profit
- Stock is a single count on one day; there is no history of how it got there
- Batches are not distinguished, so two lots of the same medicine with different expiry dates cannot both be tracked
- It knows nothing about prescriptions, schedules or which medicines may legally be sold without one
- There is no reorder level, so it says what is not moving but not what is about to run out
What to add next
This is also where you make the project yours. Take one or two of these, or something nobody here thought of:
- Add a purchase price and report margin instead of takings
- Track batches, so each lot carries its own expiry date and quantity
- Add a reorder level per medicine and print a buying list as well as an expiry list
- Send the expiry alert as an email on the first of every month
- Compare this year's monthly pattern with last year's on one chart
- Flag any medicine whose sales have fallen for three months running
16What you may have to teach yourself
CBSE expects some self-learning in a project and says so. For this one, that means:
- Installing the connector — pip install mysql-connector-python — and getting a connection open from Python. This is the step that stops most projects, and it is worth doing before you write any analysis.
- read_sql(), and why it is better to pull rows out with plain SQL and aggregate in pandas than to write a complicated GROUP BY
- Date arithmetic: subtracting two dates gives a Timedelta, and .dt.days is what turns it into a number
- What a JOIN actually does, and why the sales table stores an id rather than a name
17Conclusion
The program does what it set out to do. Two tables come out of MySQL, seven questions are answered in a second, and the shop has an alert list it can act on before anything else expires.
The number that justifies the project is Rs 34,203 — stock still on the shelf, still saleable, and inside ninety days of being worthless. Rs 27,675 of it is one product with 71 days left, which is enough time to do something about it and would not have been in a fortnight. The Rs 9,018 already lost is the same lesson learnt the expensive way.
The finding that was not expected came from a table rather than a chart. Setting each kind's sales against the stock held in it showed that "Other" — the cotton, the bandages, the thermometer — turns over 0.44 times a year. The shop has more money sitting in that shelf than it takes off it in twelve months. Nothing about a full shelf looks like a problem, which is precisely why it had never been one.
18References
Every report needs a bibliography, and a data project needs its data source at the top of it.
- The stock and sales register of a chemist shop, one year, with the owner's permission. The database shipped here is a LambdaLab sample standing in for it and contains no customer or prescription data.
- MySQL 8.0 Reference Manual — https://dev.mysql.com/doc/refman/8.0/en/
- MySQL Connector/Python Developer Guide — https://dev.mysql.com/doc/connector-python/en/
- pandas user guide, “SQL queries” — https://pandas.pydata.org/docs/user_guide/io.html#sql-queries
- Informatics Practices, Class XII — the NCERT / CBSE prescribed textbook, for the chapters on data handling with pandas, database query using SQL, and data visualisation
- pandas documentation — https://pandas.pydata.org/docs/
- Matplotlib documentation — https://matplotlib.org/stable/
- CBSE Senior School Curriculum, Informatics Practices (Subject Code 065) — the project guidelines this report follows
- LambdaLab — https://www.lambdalab.in