A Year of the Society's Electricity
Twelve months of meter readings for sixty-four flats, turned into slab-wise bills and the four arguments they settle.
1Introduction: the problem it solves
A housing society secretary writes down sixty-four meter readings every month and files the sheet. Once a year the committee meets, the electricity bill is discussed for twenty minutes, and everybody leaves with the opinion they came in with.
There are four real questions underneath that argument. Which months does the money actually go in? Is C block heavier than the others, or simply larger? Which individual flats are drawing far more than the rest? And does a bigger family really use more, or is that just something people say?
All four are answerable from the register the secretary already keeps. This project reads it, applies the slab tariff properly, and answers them in a second.
The secretary of a housing society, a resident welfare association, or anybody on a committee who has to explain why the electricity bill went up.
Why it is worth doing on a computer
Two things make this worth computerising. The first is the slab tariff. A domestic bill is not units times a rate — the first hundred units are charged at one rate, the next hundred at a higher one, and so on. Working that out by hand for sixty-four flats, twelve times a year, is 768 multi-step calculations, and the mistake people make is charging the whole bill at the top rate.
The second is that the argument at the annual meeting is never settled, because nobody brings figures to it. A chart showing that the peak month is 1.95 times the lowest ends the conversation about whether summer is really worse. A ranked list of flats ends the conversation about who is heavy. Neither of those can be produced in a meeting, and both take a second on a laptop.
Objectives
- To read a year of meter readings for a whole society out of one CSV file
- To apply the domestic slab tariff correctly, charging each part of the usage at its own rate
- To show how the society's consumption moves through the year and how far the peak is above the trough
- To compare blocks fairly, using the average per flat rather than the block total
- To rank individual flats, so an unusually heavy meter can be found and investigated
- To test whether family size explains consumption, rather than assuming it does
- To show the spread of monthly bills, so the committee knows what a typical flat actually pays
2How the job is done today
Before writing anything it is worth asking how the work is handled at present, and where each of those answers falls short. These were examined:
Complete, and where all of this data comes from. It records and does not compute: the slab arithmetic is done separately, usually on a calculator, and the annual questions are never asked of it at all.
Correct, and useless for this. They arrive one flat at a time, they carry no history, and the society cannot compare its own blocks with them.
The nearest alternative. Building the nested IF for four slabs is fiddly, and it is copied down 768 cells where any one of them can be wrong without anybody noticing.
They collect maintenance dues well. Electricity analysis is usually not in them, and where it is, the society's data ends up somewhere it cannot easily get it back from.
3Where the data came from
CBSE asks that any resource used in a project be suitably referenced, and for a data project that rule is not a formality — a figure with no source attached to it does not mean anything. This section is the one an examiner will ask about.
The society's secretary reads every meter in the first week of the month and writes flat number, block, occupants and units into a register. One year of that register — twelve readings for each of sixty-four flats — was copied into readings.csv.
The number of occupants is the only field not on the meter. It comes from the society's own membership list and is the figure the committee already uses for water charges.
The dataset shipped here is a LambdaLab sample of 769 rows standing in for that register, complete with a reading entered twice, five meters that were not read and a block letter typed in lower case. Use your own society's register in your submission, with the secretary's permission, and say in the report which society and which year.
4The dataset
One file in, one file out. readings.csv is the reading register as it is already kept — one row per flat per month. The slab tariff is not in the file: it is in the program, in one place, so a change in the tariff is a one-line edit rather than a hunt.
readings.csv — one row per flat per month
| Field | Type | What it holds |
|---|---|---|
flat_no | text | The flat, e.g. A-101. The block letter is in it, and it is also its own column. |
block | text | A, B or C. |
occupants | integer | How many people live in the flat, from the membership list. |
month | text (YYYY-MM) | The month the reading is for. Written this way round so it sorts correctly. |
units | integer | Units consumed that month. Blank if the meter could not be read. |
The slab tariff, which lives in the program rather than the file
| Field | Type | What it holds |
|---|---|---|
First 100 units | Rs 4.50 per unit | The lifeline slab — every flat pays this rate on its first hundred units. |
101 to 200 | Rs 6.00 per unit | Only the units in this band are charged at this rate. |
201 to 400 | Rs 7.75 per unit | And likewise here. |
Above 400 | Rs 9.20 per unit | The top slab, with no upper limit. |
Fixed charge | Rs 90.00 per month | Added to every bill whatever the usage, even a zero one. |
The first few lines of readings.csv
| flat_no | block | occupants | month | units |
|---|---|---|---|---|
A-101 | A | 3 | 2025-07 | 240 |
A-101 | A | 3 | 2025-08 | 267 |
A-101 | A | 3 | 2025-09 | 215 |
A-101 | A | 3 | 2025-10 | 203 |
A-101 | A | 3 | 2025-11 | 179 |
A-101 | A | 3 | 2025-12 | 144 |
A-101 | A | 3 | 2026-01 | 144 |
A-101 | A | 3 | 2026-02 | 167 |
Inside readings.csv
The society's reading register: 769 rows, one per flat per month, with the mistakes a handwritten register has in it. The whole file is 769 rows, 16.5 KB — too much to print here, so this is the head of it. The complete file comes with the download, and you can also take it on its own.
flat_no,block,occupants,month,units
A-101,A,3,2025-07,240
A-101,A,3,2025-08,267
A-101,A,3,2025-09,215
A-101,A,3,2025-10,203
A-101,A,3,2025-11,179
A-101,A,3,2025-12,144
A-101,A,3,2026-01,144
A-101,A,3,2026-02,1675Cleaning the data
Real data arrives with mistakes in it, and this dataset has the ones real data actually has. What was wrong, how much of it there was, and what the program does about each — because how a problem is handled changes the answer, and a report has to say which choice it made.
drop_duplicates(). A flat has one reading a month, so an exact repeat is a slip of the pen and would otherwise be billed twice.
dropna(subset=["units"]) drops them and the count is printed, so the secretary knows five meters were missed. Filling them with an average would put a bill on a flat nobody measured.
str.strip().str.upper(). Left alone, block "a" would appear as a fourth block with two readings in it and a nonsensical average.
A blank anywhere in a column forces pandas to store the whole column as float. astype(int) after the blanks are gone puts it back.
6What the program does
- Reads a year of meter readings for a whole society from one CSV file
- Cleans it: removes a repeated reading, drops meters that were not read, and folds a lower-case block letter back in
- Applies a four-band slab tariff correctly, charging each part of the usage at its own rate
- Shows the society's consumption month by month and how far the peak is above the trough
- Compares blocks by total and by average per flat, which are different answers to different questions
- Ranks the ten heaviest flats of the year
- Measures how strongly consumption tracks family size, instead of assuming it does
- Describes the spread of monthly bills across the society
- Writes a month-by-month summary out as a CSV for the notice board
The pandas and pyplot it is built from
| Call | Where | What it is for |
|---|---|---|
pd.read_csv() | step 1 | Loads the reading register |
df.drop_duplicates() | step 2 | Removes a reading entered twice |
Series.str.strip().str.upper() | step 2 | Folds block "a" back into block "A" |
df.dropna(subset=["units"]) | step 2 | Drops the meters that were not read |
Series.apply(bill_for) | step 3 | Runs the slab calculation down the whole column |
min(units, limit) - used | inside bill_for | How much of the usage falls inside this slab, and no more |
df.groupby(col)[v].sum() | step 4 | The month totals and the per-flat totals |
df.groupby(col)[v].mean() | step 4 | The block and family-size averages |
Series.sort_values(ascending=False) | step 4 | Ranks the flats, heaviest first |
Series.corr(other) | step 5 | How closely two columns move together, from -1 to 1 |
Series.idxmax() / idxmin() | step 4 | Names the peak and the trough month |
pd.DataFrame({...}) | step 4 | Puts two Series side by side in one table |
df.groupby().agg(name=(col, how)) | step 6 | Two different sums in one pass, each with the name it should have |
Series.describe() | step 6 | The spread of the bills in one call |
plt.barh() / plt.hist() | steps 4, 6 | Sideways bars for flat numbers, a histogram for the bills |
7Technical details
| Language | Python 3 |
| Where the data lives | A plain CSV file, read into pandas |
| Libraries |
|
8How it works, step by step
read_csv() loads readings.csv — 769 rows covering 64 flats and 12 months.
The repeated reading goes, the block letter is upper-cased, unread meters are dropped and counted, and units goes back to whole numbers.
bill_for() walks the four slabs, charging only the part of the usage inside each. apply() runs it down the whole units column.
groupby() gives the monthly totals, the block averages, the per-flat totals and the average by family size.
corr() puts a number on how closely occupants and units move together, so the committee's assumption can be tested rather than repeated.
Five charts — a line, two bars, a horizontal bar and a histogram — each saved with savefig().
9Source code
The whole program. Every chart further down this page was drawn by this listing, and every figure quoted came out of running it.
# ---------------------------------------------------------------------------
# electricity_analysis.py
#
# A year of meter readings for one housing society, taken from the register
# the secretary keeps, and the five questions the committee argues about at
# every annual meeting:
#
#   1. Which months does the society actually spend its money in?
#   2. Which block uses the most, and is that only because it is bigger?
#   3. Which flats are the heaviest users?
#   4. Does a bigger family really use more, or is that just assumed?
#   5. What does a typical flat pay, once the slab rates are applied?
#
# The tariff is the domestic slab rate; change SLABS to your own state's.
# ---------------------------------------------------------------------------

import pandas as pd
import matplotlib.pyplot as plt

# (up to this many units, rate per unit). The last slab has no upper limit,
# so it is written as a very large number rather than as a special case.
SLABS = [(100, 4.50), (200, 6.00), (400, 7.75), (10 ** 9, 9.20)]
FIXED_CHARGE = 90.00          # a fixed monthly charge, whatever the usage


def bill_for(units):
    """The rupee bill for one month's units, applying each slab in turn."""
    total = FIXED_CHARGE
    used = 0                            # units already charged in a lower slab
    for limit, rate in SLABS:
        if units <= used:               # nothing left to charge
            break
        # Only the part of the usage that falls inside this slab is charged
        # at this slab's rate. This is the point students most often get
        # wrong: the whole bill is NOT charged at the top rate.
        in_slab = min(units, limit) - used
        total = total + in_slab * rate
        used = limit
    return round(total, 2)


# --- 1. Read and clean ---------------------------------------------------
df = pd.read_csv("readings.csv")
print("Readings in the register :", len(df))

before = len(df)
df = df.drop_duplicates()
print("Duplicate readings removed:", before - len(df))

df["block"] = df["block"].str.strip().str.upper()   # "a" and "A" are one block

# A blank means the meter could not be read that month. It is left out rather
# than filled with a guess, and the count is printed so the secretary knows
# how many meters were missed.
missed = df["units"].isnull().sum()
df = df.dropna(subset=["units"])
df["units"] = df["units"].astype(int)
print("Meters not read          :", missed)
print("Readings used            :", len(df))
print("Flats                    :", df["flat_no"].nunique())
print()

# --- 2. Derive: what each reading costs ----------------------------------
# apply() sends every value of the units column through bill_for().
df["bill"] = df["units"].apply(bill_for)

print("Units for the year   :", df["units"].sum())
print("Billed for the year  : Rs", round(df["bill"].sum(), 2))
print("Average monthly bill : Rs", round(df["bill"].mean(), 2))
print()

# --- 3. Question 1: which months? ----------------------------------------
monthly = df.groupby("month")["units"].sum()

print("--- Units used, month by month ---")
print(monthly)
print()
print("Highest month:", monthly.idxmax(), "at", monthly.max(), "units")
print("Lowest  month:", monthly.idxmin(), "at", monthly.min(), "units")
# The guard is not decoration. A month in which nothing was drawn is unlikely
# in a whole society and perfectly possible in a small one, and without this
# line the program stops with ZeroDivisionError at the last hurdle.
if monthly.min() > 0:
    print("The peak month is", round(monthly.max() / monthly.min(), 2), "times the lowest.")
else:
    print("One month drew nothing at all, so there is no ratio to give.")
print()

plt.figure(figsize=(9, 4.5))
plt.plot(monthly.index, monthly.values, marker="o", color="#e07b39")
plt.title("Units used by the society, month by month")
plt.xlabel("Month")
plt.ylabel("Units (kWh)")
plt.xticks(rotation=45)
plt.grid(True, linestyle="--", alpha=0.5)
plt.tight_layout()
plt.savefig("chart1_monthly_units.png")
plt.close()

# --- 4. Question 2: which block? -----------------------------------------
# Two figures, because they answer different questions. The total says where
# the money goes; the average per flat says whether a block is really heavier
# or simply larger.
block_total = df.groupby("block")["units"].sum()
block_avg = df.groupby("block")["units"].mean().round(1)

print("--- Block by block ---")
print(pd.DataFrame({"total_units": block_total, "average_per_flat_month": block_avg}))
print()

plt.figure(figsize=(8, 4.5))
plt.bar(block_avg.index, block_avg.values, color="#4c9f70")
plt.title("Average monthly units per flat, by block")
plt.xlabel("Block")
plt.ylabel("Average units per flat per month")
plt.tight_layout()
plt.savefig("chart2_block_average.png")
plt.close()

# --- 5. Question 3: which flats are heaviest? ----------------------------
per_flat = df.groupby("flat_no")["units"].sum().sort_values(ascending=False)

print("--- Ten heaviest flats for the year ---")
print(per_flat.head(10))
print()

top10 = per_flat.head(10)[::-1]
plt.figure(figsize=(8, 5))
plt.barh(top10.index, top10.values, color="#3b7dd8")
plt.title("Ten heaviest flats, units for the year")
plt.xlabel("Units (kWh)")
plt.tight_layout()
plt.savefig("chart3_top_flats.png")
plt.close()

# --- 6. Question 4: does family size explain it? -------------------------
by_size = df.groupby("occupants")["units"].mean().round(1)
print("--- Average monthly units by number of occupants ---")
print(by_size)
print()
# corr() gives a number between -1 and 1. Near 1 means the two rise together.
print("Correlation between occupants and units:",
      round(df["occupants"].corr(df["units"]), 3))
print()

plt.figure(figsize=(8, 4.5))
plt.bar(by_size.index.astype(str), by_size.values, color="#c9772f")
plt.title("Average monthly units by size of the family")
plt.xlabel("Number of occupants")
plt.ylabel("Average units per month")
plt.tight_layout()
plt.savefig("chart4_occupants.png")
plt.close()

# --- 7. Question 5: what does a typical bill look like? ------------------
print("--- Monthly bills ---")
print(df["bill"].describe().round(2))
print()

plt.figure(figsize=(8, 4.5))
plt.hist(df["bill"].values, bins=12, color="#a05fc0", edgecolor="white")
plt.title("Spread of monthly bills across the society")
plt.xlabel("Bill for one flat for one month (Rs)")
plt.ylabel("Number of bills")
plt.tight_layout()
plt.savefig("chart5_bill_spread.png")
plt.close()

# --- 8. The sheet the secretary puts on the notice board -----------------
summary = df.groupby("month").agg(units=("units", "sum"),
                                  billed=("bill", "sum")).round(2)
summary.to_csv("month_summary.csv")

print("Charts saved : chart1_monthly_units.png .. chart5_bill_spread.png")
print("Summary saved: month_summary.csv")The full report as a PDF, ready to print and fill in. Or the working project as a zip — the program, the dataset, the charts and a README.
10Sample output
A real run, reproduced exactly as it appeared. Nothing below was typed by hand — it is the transcript of the program above against the dataset in section 4.
Readings in the register : 769
Duplicate readings removed: 1
Meters not read          : 5
Readings used            : 763
Flats                    : 64

Units for the year   : 152045
Billed for the year  : Rs 910465.8
Average monthly bill : Rs 1193.27

--- Units used, month by month ---
month
2025-07    15168
2025-08    14244
2025-09    13264
2025-10    11721
2025-11     9624
2025-12     8761
2026-01     8910
2026-02     9697
2026-03    11914
2026-04    14888
2026-05    17074
2026-06    16780
Name: units, dtype: int64

Highest month: 2026-05 at 17074 units
Lowest  month: 2025-12 at 8761 units
The peak month is 1.95 times the lowest.

--- Block by block ---
       total_units  average_per_flat_month
block
A            53933                   188.6
B            52811                   184.0
C            45301                   238.4

--- Ten heaviest flats for the year ---
flat_no
C-104    5454
C-107    3599
A-119    3514
B-121    3363
C-108    3352
C-105    3262
A-121    3237
B-105    3169
A-108    3059
B-118    3028
Name: units, dtype: int64

--- Average monthly units by number of occupants ---
occupants
1    122.3
2    180.7
3    208.0
4    231.7
5    324.3
Name: units, dtype: float64

Correlation between occupants and units: 0.566

--- Monthly bills ---
count     763.00
mean     1193.27
std       569.14
min       301.50
25%       798.00
50%      1074.00
75%      1496.50
max      5100.40
Name: bill, dtype: float64

Charts saved : chart1_monthly_units.png .. chart5_bill_spread.png
Summary saved: month_summary.csv
Running it also wrote month_summary.csv — 12 rows. This is the head of it:
month,units,billed
2025-07,15168,92918.2
2025-08,14244,86237.65
2025-09,13264,79054.85
2025-10,11721,68313.05
2025-11,9624,54663.5
2025-12,8761,49343.75
2026-01,8910,50294.25
2026-02,9697,55226.5
2026-03,11914,69509.511The charts, and what each one says
CBSE asks for appropriate charts, and the word doing the work in that phrase is appropriate. A line for something that moves in order, a bar to compare things that do not, a histogram for the shape of one column of numbers. Each chart below says which it is, why that kind was chosen, and what it turned out to show.
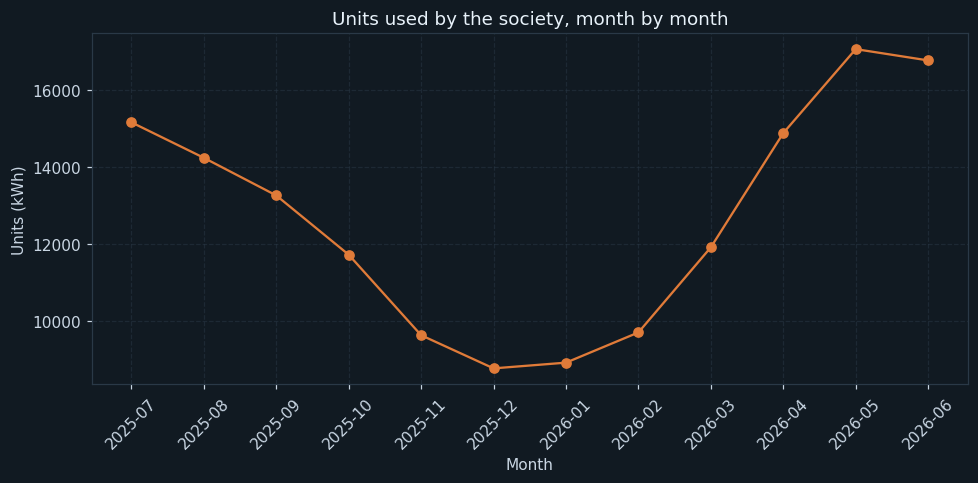
One point per month, from July to the following June, with the height being every unit the society drew that month. A line chart, because the months are in order and the shape is the message.
The curve is a clean U turned upside down: 17,074 units in May and 8,761 in December. The peak month is 1.95 times the lowest — the society very nearly doubles its consumption between winter and summer.
There is no way to look at that and go on treating the electricity bill as a fixed monthly cost. The society's money problem is a four-month problem, and any measure that only helps in December is aimed at the wrong end of this chart.
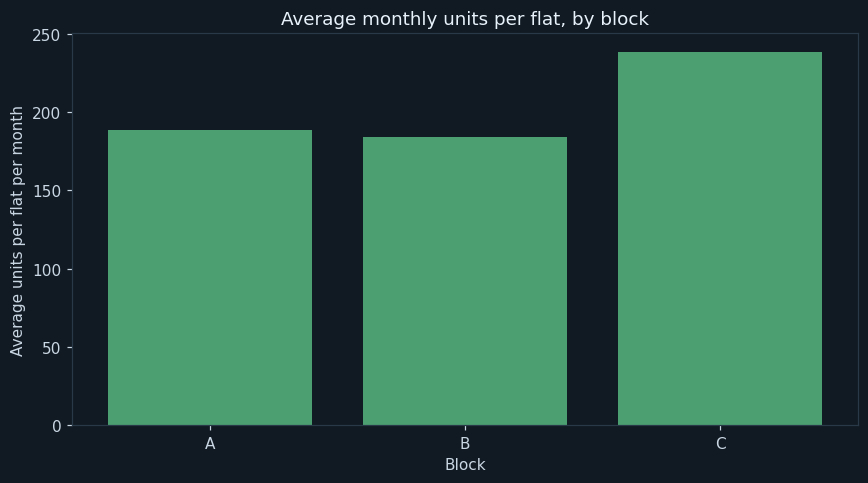
Average units per flat per month, block by block. The average, not the total — C block has 16 flats to A and B's 24 each, so totals would say nothing except which block is bigger.
C block averages 238.4 units per flat per month against A's 188.6 and B's 184.0 — about 27 per cent more than either.
The totals told the opposite story: A block's 53,933 units for the year is the largest of the three. Both figures are correct and they answer different questions, and this is the trap the committee had fallen into. A block uses the most electricity; C block's flats use the most electricity. Only the second sentence is about behaviour.
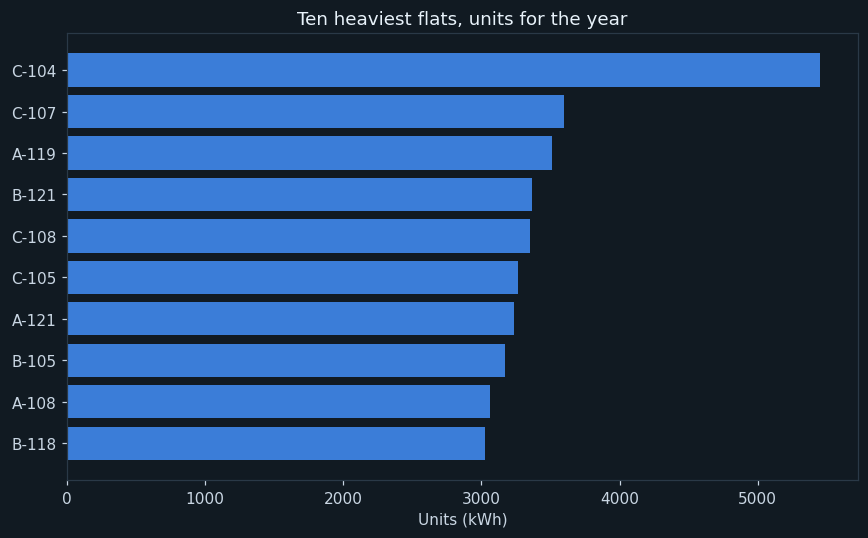
Total units for the year for the ten largest meters, biggest at the top, drawn sideways because flat numbers do not fit under vertical bars.
C-104 drew 5,454 units in the year. The next flat on the list, C-107, drew 3,599 — so the top flat is 52 per cent above the one behind it, which is a much bigger step than any other gap in the list.
That is not an accusation, it is a question worth asking: a gap that size is usually a faulty meter, a second connection or a genuinely different household. It took one chart to find and would never have been noticed in the register.
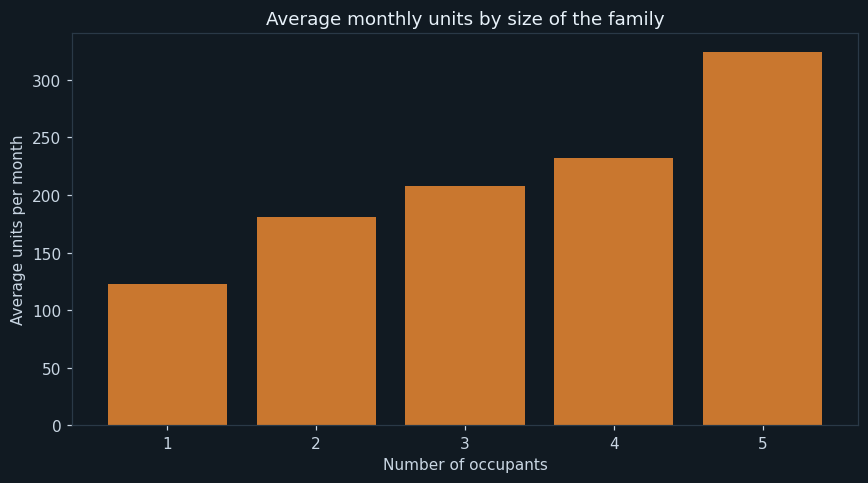
Average monthly units for households of one, two, three, four and five people. The bars are in order because the thing on the axis is a count, so the reader is meant to follow it left to right.
Yes, and steadily: 122.3 units for a single person, rising to 324.3 for a household of five. The correlation between occupants and units is 0.566 — a real relationship, but nothing like a perfect one.
That 0.566 is the most useful number in the project. It says family size explains part of the difference between flats and nowhere near all of it, so the society cannot bill by household size and call it fair, and neither can it dismiss a heavy flat as "they are a big family" without looking.
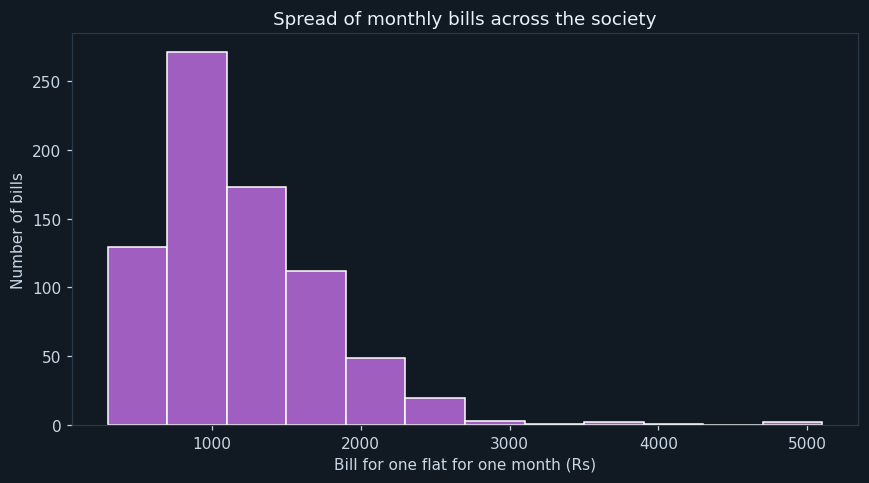
All 763 monthly bills sorted into twelve bands, with the height being how many bills fell into each. A histogram, because the question is the shape of the spread rather than any single flat.
The median bill is Rs 1,074 and the mean Rs 1,193.27 — the mean is higher because of the tail on the right, which runs out to a single bill of Rs 5,100.40.
The smallest bill of the year was Rs 301.50. The society therefore contains flats whose bills differ by a factor of seventeen in the same month, under the same tariff, which is worth knowing before anybody proposes charging electricity as a flat rate per flat.
12What the analysis found
- The society used 152,045 units in the year and was billed Rs 910,465.80.
- May is the peak month at 17,074 units and December the lowest at 8,761 — a ratio of 1.95.
- C block averages 238.4 units per flat per month against A's 188.6 and B's 184.0.
- A block has the highest total consumption and the second-lowest per flat; total and average disagree.
- One flat, C-104, drew 5,454 units — 52 per cent more than the next heaviest.
- Consumption rises with family size, from 122.3 units for one person to 324.3 for five, at a correlation of 0.566.
- A typical monthly bill is Rs 1,074, but they run from Rs 301.50 to Rs 5,100.40.
What should be done about them
This is the part that turns an analysis into a project. A chart that nobody acts on is a picture; a recommendation somebody can argue with is a result.
- Plan the society's cash for a four-month summer peak rather than a flat monthly bill.
- Have C-104's meter checked. A gap of that size usually has a physical explanation.
- Stop comparing blocks by total. Put the per-flat average on the notice board instead.
- Do not bill by household size. At a correlation of 0.566 it would be unfair to about half the society.
- Read every meter. Five missed readings in a year is five bills that had to be estimated.
- Put the month-wise chart on the notice board in March, before the summer, not in July when the bill has already arrived.
13Testing
Every case below was actually executed and its result recorded as it appeared — including the ones expected to fail. Each one builds a small dataset of its own and runs the whole program against it.
| Test case | Expected | Actual | Result |
|---|---|---|---|
| The full register, 769 readings | Units for the year : 152045 | Units for the year : 152045 | Pass |
| Meters that were not read are counted and dropped | Meters not read : 5 | Meters not read : 5 | Pass |
| A reading entered twice is removed | Duplicate readings removed: 1 | Duplicate readings removed: 1 | Pass |
| Block 'a' is folded back into block 'A' | Flats : 64 | Flats : 64 | Pass |
| A flat using exactly 0 units | Average monthly bill : Rs 90.0 | Average monthly bill : Rs 90.0 | Pass |
| A flat using exactly 100 units | Average monthly bill : Rs 540.0 | Average monthly bill : Rs 540.0 | Pass |
| A flat using exactly 101 units | Average monthly bill : Rs 546.0 | Average monthly bill : Rs 546.0 | Pass |
| A flat using exactly 200 units | Average monthly bill : Rs 1140.0 | Average monthly bill : Rs 1140.0 | Pass |
| A flat using exactly 201 units | Average monthly bill : Rs 1147.75 | Average monthly bill : Rs 1147.75 | Pass |
| A flat using exactly 400 units | Average monthly bill : Rs 2690.0 | Average monthly bill : Rs 2690.0 | Pass |
| A flat using exactly 401 units | Average monthly bill : Rs 2699.2 | Average monthly bill : Rs 2699.2 | Pass |
| A flat that used nothing still pays the fixed charge | Billed for the year : Rs 90.0 | Billed for the year : Rs 90.0 | Pass |
| An unread meter is not given an estimated bill | Readings used : 1 | Readings used : 1 | Pass |
| ...and the year's units are the one real reading | Units for the year : 240 | Units for the year : 240 | Pass |
| Block totals and block averages disagree, correctly | A 200 100.0 | A 200 100.0 | Pass |
| ...the smaller block has the higher average | C 150 150.0 | C 150 150.0 | Pass |
| readings.csv missing altogether | FileNotFoundError: [Errno 2] No such file or directory: 'readings.csv' | FileNotFoundError: [Errno 2] No such file or directory: 'readings.csv' | Pass |
Two kinds of case are in there on purpose. The boundary cases test the edge of a rule, where a program is most often wrong by one. The failure cases check that it stops cleanly and says why, instead of quietly producing a wrong answer.
14Advantages
Set against the ways the job is done today:
- The slab tariff is applied the same way for every flat every month, which hand calculation cannot promise
- The tariff sits in one place, so a change in the rates is a one-line edit
- Blocks are compared fairly, by the average per flat rather than by size
- An unusual meter is found in a second instead of never
- An assumption the committee had been repeating for years is tested and given a number
- The whole year is re-analysed with one command when next year's readings are added
15Limitations and future scope
What this version cannot tell you
A data project should be honest about the limits of its own data. Each of these is a reason for one of the additions below:
- It bills domestic slabs only — there is no separate commercial or common-area tariff
- Common lighting, lifts and pumps are not in the register at all, so this is flats only
- The number of occupants is taken as fixed for the year, and families change
- A missed reading is dropped rather than estimated, so five months of five flats are simply absent
- It says nothing about why a flat is heavy — a geyser, an air conditioner and a faulty meter look identical here
What to add next
This is also where you make the project yours. Take one or two of these, or something nobody here thought of:
- Add the common-area meter and show what the society pays before any flat is billed
- Print a one-page bill per flat, ready to be slipped under the door
- Compare this year with last year on one chart
- Flag any flat whose consumption jumps more than 50 per cent over its own average, which is how a fault shows up
- Add a solar generation column and show what it actually saved
- Let the tariff be read from a small file, so the treasurer can update it without opening the program
16What you may have to teach yourself
CBSE expects some self-learning in a project and says so. For this one, that means:
- How a slab tariff really works. Look at a real electricity bill and find the bands — the common mistake of charging everything at the top rate is worth making once, on paper, to see how wrong it goes.
- corr(), what a correlation between -1 and 1 means, and why 0.566 is neither nothing nor proof
- The difference between a total and an average, which is the whole of this project's second chart
- Your own state's domestic tariff, from the electricity board's website — the slabs here are a plausible set, not your state's
17Conclusion
The program does what it set out to do. A year of meter readings, kept exactly as the secretary already keeps them, comes back as correct slab-wise bills and five charts, and the four questions the annual meeting argues about now have figures attached.
Two of the findings changed what the committee believed. A block uses more electricity than C block and C block's flats use more than A block's — both true, and the society had been quoting the first while meaning the second. And the assumption that a big family explains a big bill turned out to be half right: a correlation of 0.566 is real, and it is not enough to bill anybody on.
The part that needed the most care was the slab function. It is eleven lines and it is the only place in the project where a wrong answer would look completely reasonable — a bill charged entirely at the top rate is still a plausible-looking number. That is why it is the part with a test at every band edge, from below and from above.
Writing those tests found a real fault, which is the argument for writing them. A society in which some month drew nothing at all made the program stop with ZeroDivisionError on the line that compares the peak month with the lowest. It would never have happened on the full register and it happens immediately on a single flat, which is exactly the kind of case a person testing by eye does not think to try. The line is now guarded, and the guard is in the listing.
18References
Every report needs a bibliography, and a data project needs its data source at the top of it.
- The reading register of one housing society, one year, with the secretary's permission. The dataset shipped here is a LambdaLab sample standing in for it.
- The domestic slab tariff of a state electricity regulatory commission — the bands in this program are a representative set, and yours should be your own state's published tariff, cited by date.
- pandas user guide, “Group by: split-apply-combine” — https://pandas.pydata.org/docs/user_guide/groupby.html
- Informatics Practices, Class XII — the NCERT / CBSE prescribed textbook, for the chapters on data handling with pandas and data visualisation
- pandas documentation — https://pandas.pydata.org/docs/
- Matplotlib documentation — https://matplotlib.org/stable/
- CBSE Senior School Curriculum, Informatics Practices (Subject Code 065) — the project guidelines this report follows
- LambdaLab — https://www.lambdalab.in